C7+ Characterization
First time reading about C7+ characterization?
Check out our article on the topic here!
The largest uncertainty in phase behavior predictions for petroleum mixtures comes from the distribution of paraffinic, napthanic and aromatic compounds in the single carbon number pseudo-components starting from heptane (C7). The number of compounds in a single carbon number component increases exponentially, resulting in most petroleum mixtures having 100s or usually many 1000s of unknown and un-measurable components in the mixture.
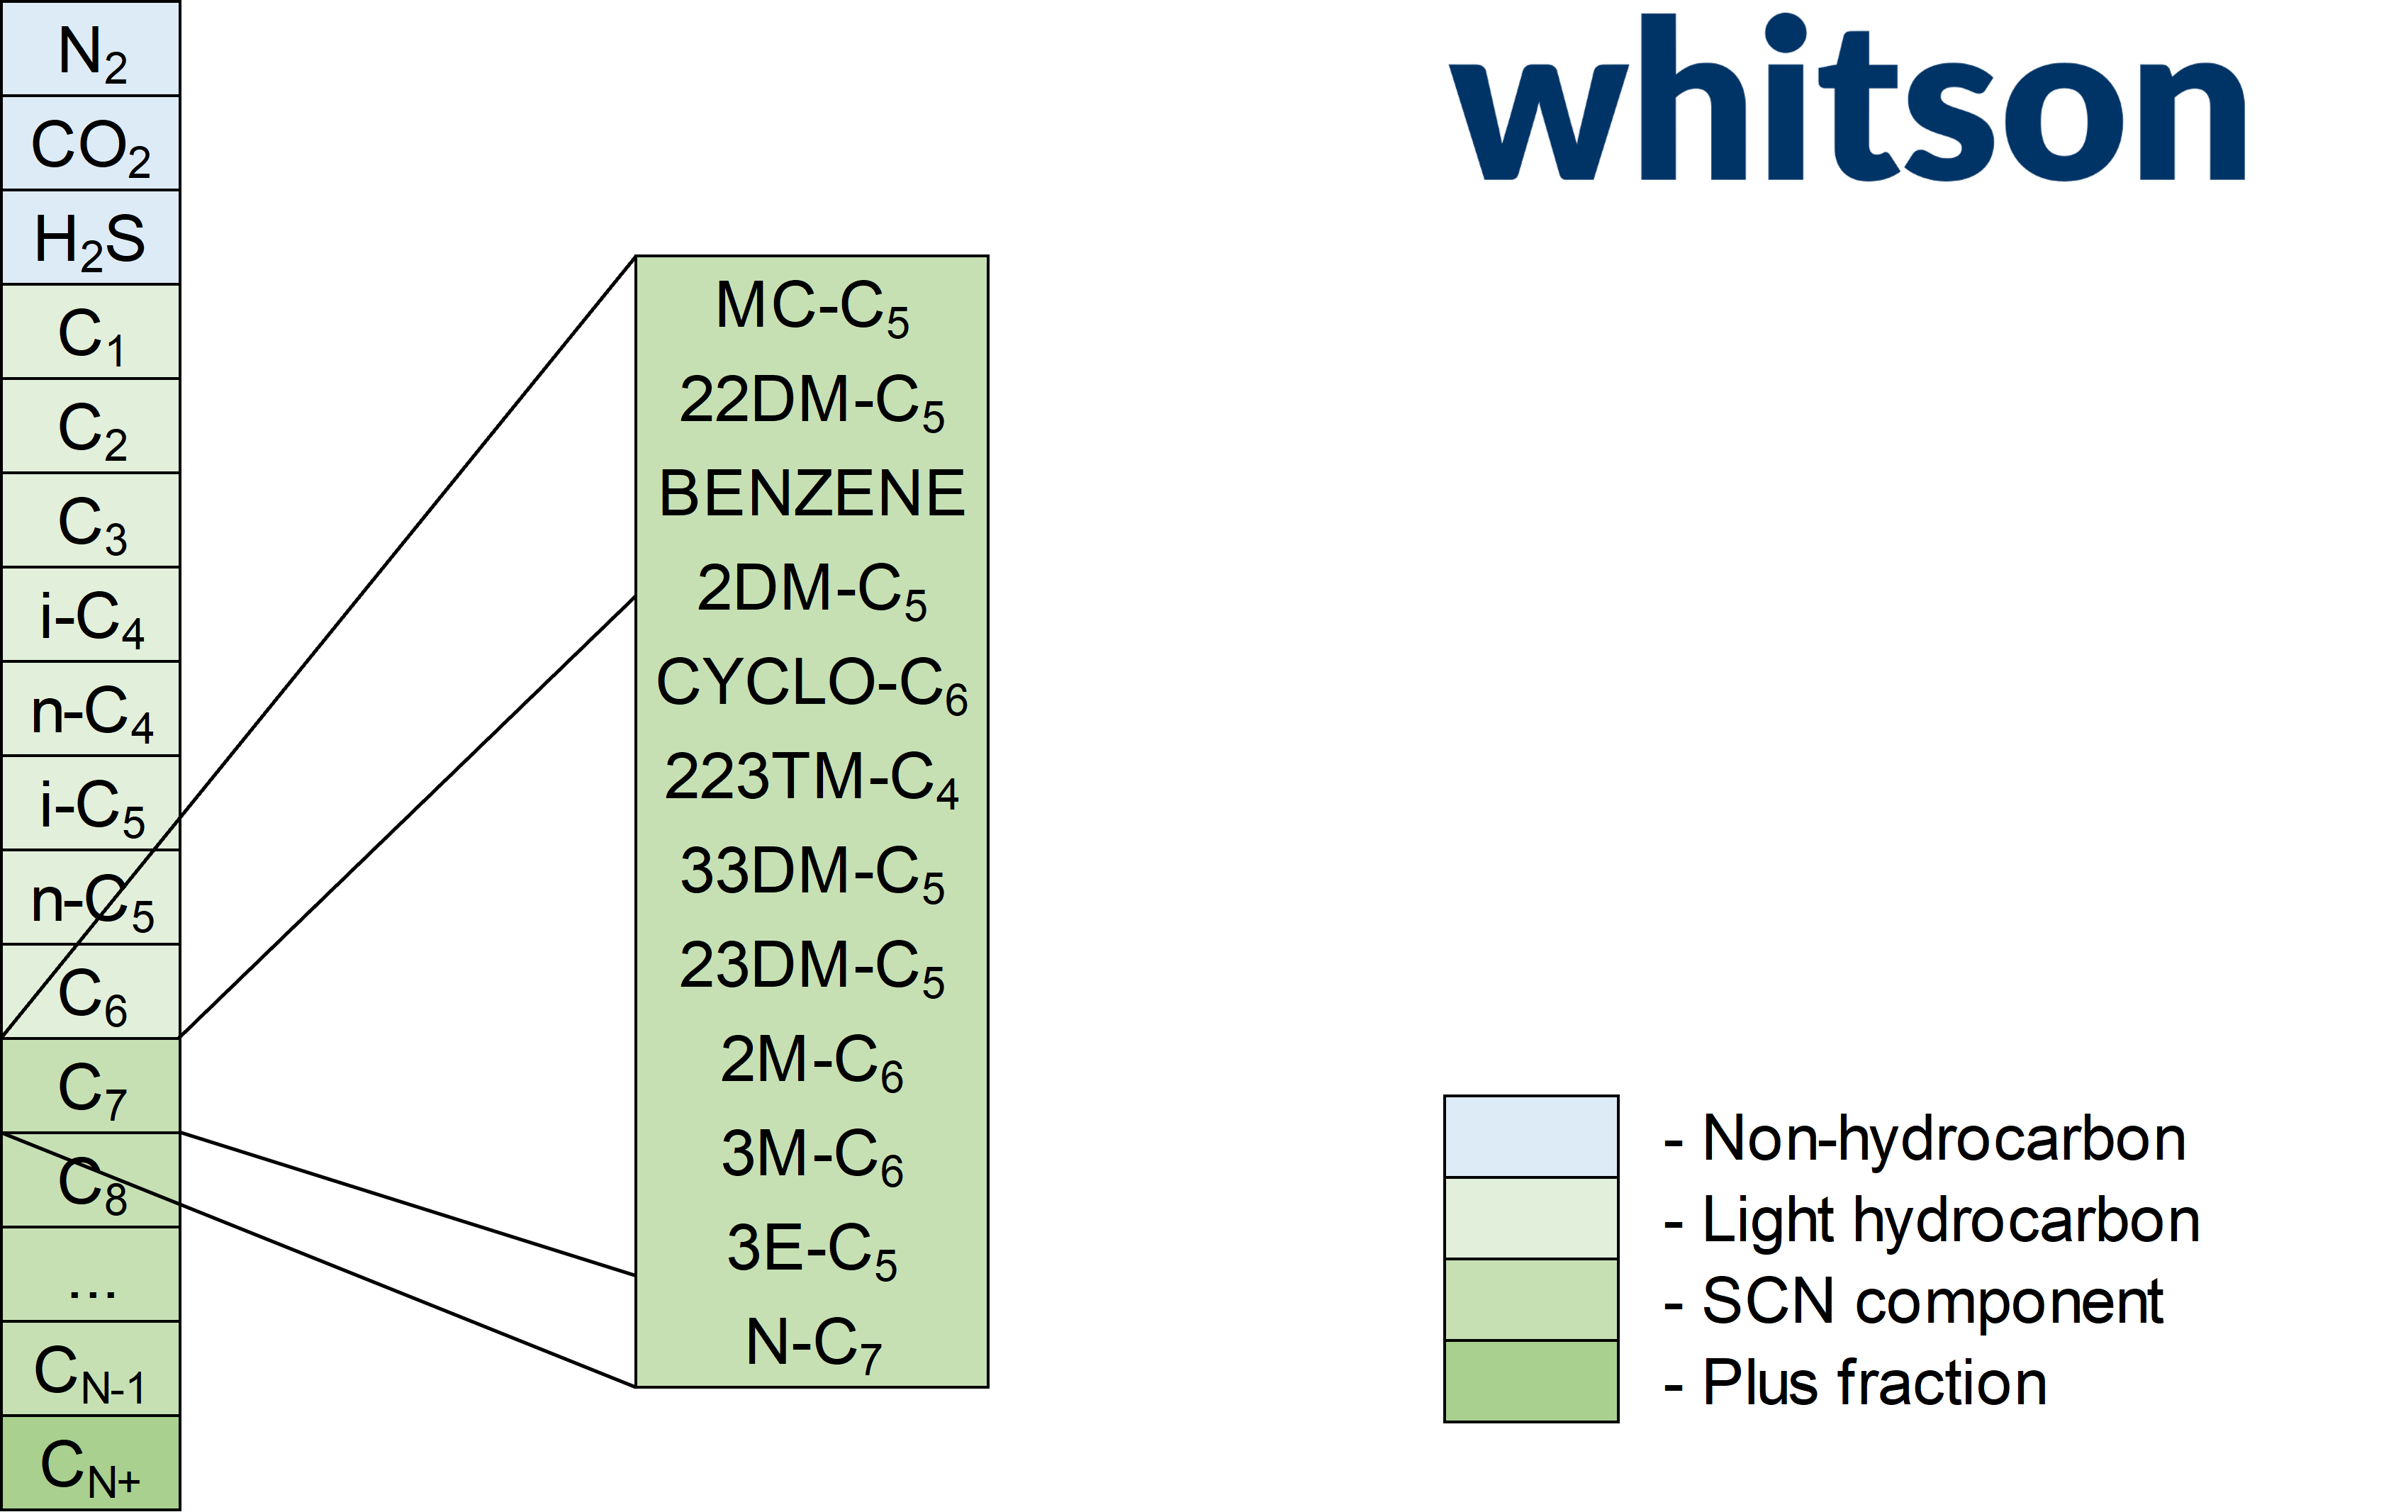
The goal of the heptane plus (C7+) characterization is to attempt to describe the fluid phase behavior by honoring measured data that reflects the fluid character. This data includes the measured mass compositions, measured flashed oil average density and average molecular weight, and if available, distillation data.
Equation of State (EOS) Model
What would we recommend if this is your first time?
Make two cases keeping all parameters as default, only change the MW correlation type! You will see the effects of this choice in your EOS Tuning.
If you are testing the LMW regression cases and you are getting warnings, try changing the MW method to correlation, and not gamma model.
To start the C7+ characterization, the first choice you have to make is what type of EOS model are you going to use. In whitsonPVT you have the choice between the Peng-Robinson (PR) model from 1978 or the Soave-Redlich-Kwong (SRK) model. Both EOS models utilize the Peneloux volume shifts by default.
In addition to the EOS model type, you also need to select a molecular weight model. The role of this model is to generate representative SCN component molecular weights for your C7+ components. The choice of method to generate the SCN molecular weights are either from the gamma model or from a correlation. The molecular weight correlations available in whitsonPVT are the Twu model and the Effective Paraffin model. The molecular weight correlation will also be used in the lower molecular weight estimation for the gamma model feature.
Gamma Molar Distribution Model
What would we recommend if this is your first time?
Is this your first time learning about the gamma model? Check out our user guide article on the topic here!
Do you have a limited dataset with similar compositions? Avoid doing LMW regression, and just go with the default parameter tuning!
If you want to perform LMW regression, start with the bounded regression first (it's a bit safer), then you can try the unbounded regression after! If you're getting warnings about the MWs not being physical, don't panic, try using the correlation option in the MW method!
The gamma molar distribution model is a mathematical model that can predict mole composition (zi), molecular weights (Mi), and in turn mass compositions (wi) for the C7+ single carbon number components. The input parameters to the gamma molar distribution model are:
-
Shape Factor (\(\alpha\))
-
Bound (\(\eta\))
-
Average molecular weight (\(\bar{M}_{Cn+}\))
-
Component lower molecular weights (\(M_{L,i}\))
Additional parameters that need to be specified in the whitsonPVT gamma molar distribution model is the first plus fraction component (typically C7+), and the molecular weight model used to generate the inital estimates for the lower molecular weight bounds.
Tuning the gamma model parameters in whitsonPVT is as simple as locking or unlocking the 🔒 symbol! There are three selections for the estimates of lower molecular weights. The first choice is to use the correlation values, which are estimated using the molecular weight correlation specified above! The remaining two options applies tuning on the lower molecular weights to match the flashed oil mass composition for the C7+ components. These methods are not recommended if a small number of fluids are used in the C7+ characterization or if all the samples have a similar average molecular weight. The reason for this is that this might result in over-fitting.
The difference between the bounded and unbounded methods for lower molecular weight tuning that the bounded regression has a lower limit on the \(\Delta M_{L,i}\) can be. This approach is not as flexible, but has a higher probability of resulting in more realistic component molecular weights for the SCN components from the gamma model (if the MW method is chosen to use the gamma model values).
Specific Gravity Model
What would we recommend if this is your first time?
Leave everything as is and see how well you predict the results!
If you have a limited dataset (few samples or very similar flashed oil denisities), compare the results of the default Søreide parameters, the default Watson model, and the default Jacoby model.
If you have samples with a significant variation of flashed oil density (e.g. a gas+oil system), then we would recommend unlocking the Søreide model exponent parameter to get slightly better predictions for your density! You can also try a case with the molar-volume correlation type.
Two of the three measurable properties for the plus fraction are molecular weight (\(M\)) and specific gravity (\(\gamma\)). There are several sources of specific gravity and molecular weight data as summarized below:
-
Back-calculated C7+ data for flashed oil samples.
-
BTEX component data for C7, C8, and C9 components.
-
True boiling point distillation data.
The availability of specific gravity and molecular weight data above goes from most common to least common in modern PVT reports.
The relationship between specific gravity and molecular weights is important for the initial EOS model development and is the basis for the C7+ fraction characterization. For similar fluids that can most likely be described by the same EOS model, the specific gravity and molecular weight data usually fall on a relatively tight trend. This trend can indicate the aromaticity or paraffinicity of the fluid system.
Several models can be fit to match the available data and help predict the C7+ characterization of your fluid system. The models that have been implemented in whitsonPVT are given in Table 1. Tuning the specific gravity model parameters in whitsonPVT is also performed by locking or unlocking the 🔒 symbol!
Table 1: Overview of specific gravity - molecular weight models in whitsonPVT.
| Model | Parameter(s) | |||
|---|---|---|---|---|
| Søreide | Cf | Exponent | SG0 | MW0 |
| Molar-Volume | Slope | Intersect | ||
| Jacoby | Ja | |||
| Watson | Kw |
Oil-Based Mud Decontamination
In whitsonPVT mud de-contamination is performed automatically for any sample that is coupled with a mud sample in the same well. The process for coupling a contaminated sample to a mud sample is shown below. It is therefore important to input contaminated compositions into whitsonPVT, in order to avoid double-decontamination.
The mud decontamination is performed automatically with the C7+ Characterization feature using the subtraction method. To learn more about mud decontamination go to the methodoligies section here.
C7+ Characterization Results and Predictions
The results of the C7+ characterization is an initial EOS model that is characterized to the flashed oil composition, density data, and distillation data. The predictions of this data can be seen in two of the three tabs on the right hand side of the feature.
In the tab called Gamma Model, you can find the predictions of the gamma model for the C7+ normalized flashed oil composition from the gas chromatograph and distillation cuts.

In the tab called Specific Gravity Model, you can find the predictions of the specific gravity model for the flashed oil density (i.e. your stock tank oil density) and the distillation properties.
The result of the C7+ charaterization is an EOS model, and by default this model is specified to be SCN EOS model with a residual (or heaviest fraction) of C36+. The molecular weights, specific gravities, and normal boiling points for the SCN components have been estimated to honor the C7+ characterization data, and are used to estimate the EOS properties using the Twu correlation for (Tc, pc), the normal boiling point defining the acentric factor, and the specific gravities defining the volume shifts. These EOS properties for the C7+ components can be visually inspected in the EOS Properties tab with a basis of molecular weights, normal boiling points, and component name.
C7+ Characterization Cases
When developing your initial EOS model, there might be several C7+ characterization cases that you want to test and compare! By saving a C7+ characterization case, you can compare multiple model and results, and these cases will also be available in the next step in the fluid model development, namely the EOS tuning.
What's Next?
Having developed one or more C7+ characterization cases, the next step is to tune the intial EOS to PVT data! You can read about how to do this here.
Do you have any questions or comments? Feel free to reach out to our support email: support.pvt@whitson.com.