Data Digitalization - Getting Started
A tip to speed up your data entry - Copy your component slate!
If you're using Windows on a laptop computer (not extended to an external monitor), the default web-browser zoom is a bit tight! We recommend reducing the zoom to 67 or 75% depending on your computer and your personal preferences.
You can reduce the zoom by holding "CTRL" and clicking the "-" key. To increase the zoom again, simply hold "CTRL" and click "+" until you're back to 100% (or hold "CTRL" and click "0" once).
The goal of data digitalization is to take lab reported compositional and PVT data from the laboratory reported format (usually a PDF or Excel/CSV file), into a digital database format that can be easily utilized and moved. The key constraints for data digitalization for fluid data is the compromise between having a flexible enough format that can digitize all already existing report formats, but structured enough that the data can be used in a practical way!
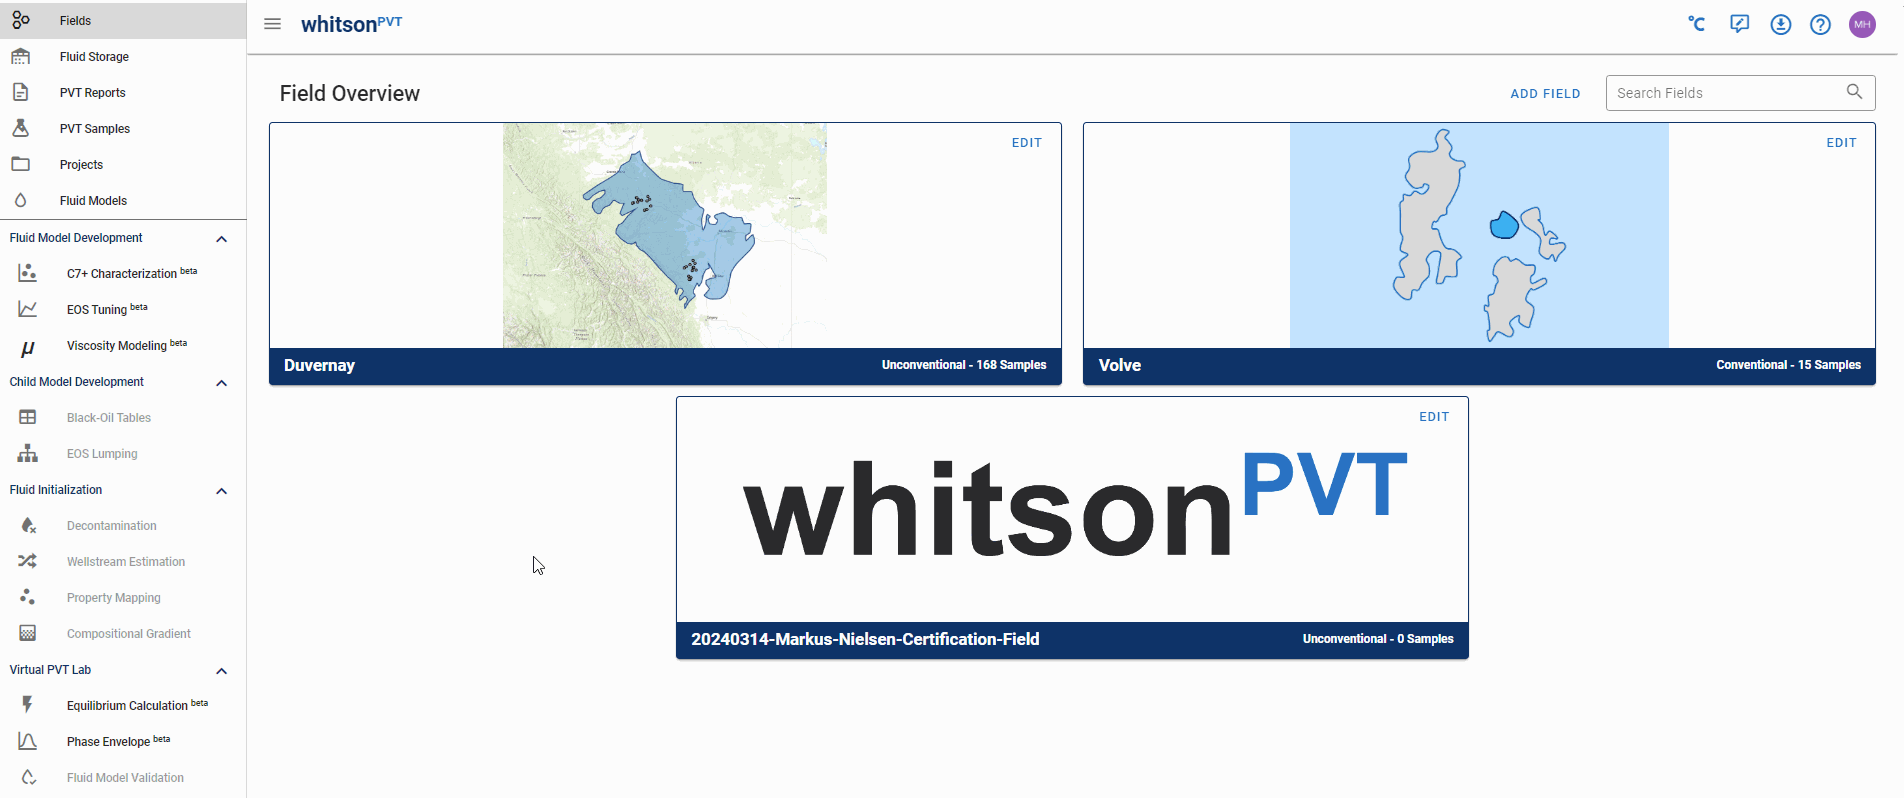
In the following sections, we will cover the data digitalization process for compositional and PVT data in whitsonPVT by looking at multiple examples from different lab reports from different decades. The datasets used in the following sections come from the Duvernay and Volve data.
Why can't you just ask an AI to do the data digitalization?
This is by far the most common question we get when showing this part of whitsonPVT. Our answer to this question is the following:
Historically, PVT and fluid data has never really been standardized data, and it would require a large dataset (thousands or 10's of thousands of PVT reports from different labs of different vintages) to even attempt to develop a machine learning algorithm that could potentially extract relevant data from a PVT report automatically. Even if such an algorithm would exist, there would be significant potential issues related to the reliability of the results of the digitalization results. To take a simple example, what data is measured or calculated in a 200+ page PVT report, is a huge Google/Amazon/Microsoft level task to solve, and there simply isn't enough demand to spend that amount of time and resources on the topic of PVT data!
What would we recommend if this is your first time?
Choosing the name of the PVT report is a choice of preference! We do not recommend naming the report with a lot of the meta data like "Well", "Formation", etc., as this is digitally attached to the samples that are linked to the digital whitsonPVT PVT report.
We suggest using a unique identifier, like the report project number, or something else. This is, however, completely up to you. We do however recommend that a company wide policy on this is decided on, to keep things as clear and understandable as possible!
The steps to digitizing a PVT report are the following (as shown in the animation above):
- Navigate to the PVT Reports section on the left-hand panel.
- Click the ADD PVT Report button in the top-right corner of the screen
- Give the report a name, select the lab, add the date of the report, and add the report file.
Once inside the digital whitsonPVT PVT report, you can start adding PVT samples! How to add compositional and PVT experimental data is covered in detail in the following sections.
Next Step
The first step when digitizing a PVT sample is to add some sample general info, then add the compositional data! Once the compositional data is digitized, the next step is to add the PVT experiment data.