PVT Experiment Data
What would we recommend if this is your first time?
The data entry is a digital twin of the PVT report! If you see something wrong, suspicious, or ambiguous, make a note of it in the General Info tab under the Note section!
If you want to learn about the details of the PVT experiments, check out our wiki on the topic here!
 The second major data type for PVT samples is the PVT experiment data. The main reason why PVT experiment data is required today is to be used to develop accurate fluid models. There are two main schools of thought around what PVT experiment data you should acquire.
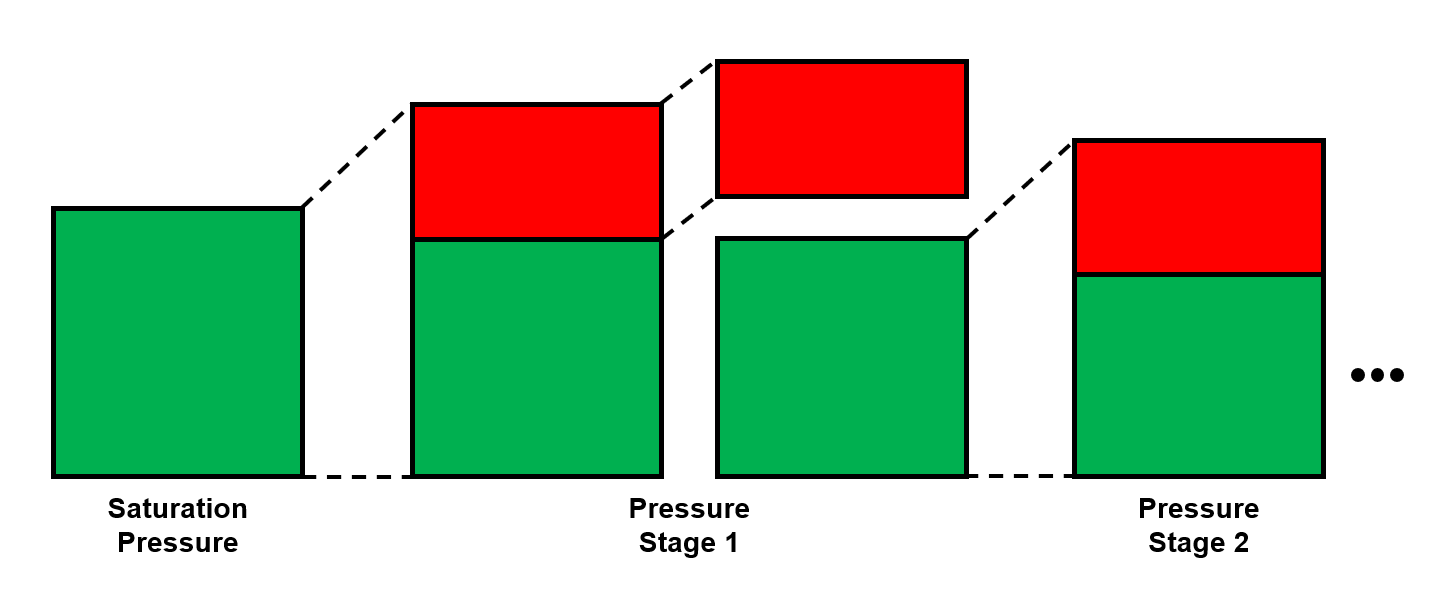
The first school of thought is the compositional path idea, that suggest that you should aim to acquire PVT data that most closely follows the compositional path of your field development (both depletion and potentially EOR solutions). This methodology is indicated in the animation above.
The second school of thought is that aquiring simple and cheap experiments at multiple temperatures (CCE experiments to be specific) is sufficient.
In either case, you still need to database and digitize the PVT experiment data, and the digitalization process for the standatd PVT experiments in whitsonPVT are given below. Examples from different labs and fluid types are also given to give you a better feel for the data.
CCE Experiments
What would we recommend if this is your first time?
Make sure you specify the correct relative volumes! The relative total volume (Vrt) is always given and is therefore next to the pressure column, and the relative oil volume is not always given and is therefore further back in the columns.
The relative oil volume can have one of two different basis, Vro = Voil / Vsaturation pressure and Vro = Voil / Vtotal! Make sure you check which one is specified in the report and select the correct one in the units section of the table!

The constant composition expansion (CCE), or sometimes called constant mass composition (CME), is the cheapest and most common PVT experiment. The main goal of this experiment is (1) to estimate the saturation pressure, and (2) estimate the liquid dropout, and (3) estimate the pressure-volume relationship. Other properties are also commonly reported, like single-phase density, gas Z-factor, and compressibility. These properties are very often calculated or a hybrid between measured and calculated. The properties in the CCE and are summarized in below with an indication of whether the property is measured or calculated:
- Pressure and volume - Measured.
- Saturation pressure - Estimated from a measured property (volume-pressure relationship).
- Saturation pressure type - Measured.
- Liquid dropout - If reported, it's measured.
- Single-phase density - Usually calculated or calculated from a single density measurement assuming constant mass and using the measured volume.
- Gas Z-factor - Calculated.
- Compressibility - Calculated, and possibly very uncertain (10-40+% deviation) based on the numerical method used to calculate it.
Example 1 - Sample CL-63169 (Duvernay)
Want to learn more about the relative oil volume?
You can convert between the two types of relative oil volume defined by the following: V(1)ro = Voil / Vtot and V(2)ro = Voil / Vsat.
The equation for converting between V(1)ro and V(2)ro is given by
This sample is a relatively standard gas condensate fluid, with a maximum liquid dropout of about 27%.
This sample's PVT data can be found in this PVT report on page 6. The data reported for this example is the following:
- Pressure - Measured directly
- Relative volume (Relative total volume in whitsonPVT) - Estimated from the measured PVT cell volume and divided by the measured volume at the saturation presure (Vrt = Vcell / Vsat).
- Liquid volume (Relative oil volume in whitsonPVT) - Estimated from the ratio between the measured oil volume and the measured total PVT cell volume (Vro = Voil / Vtot). This is one of two types of liquid relative volume that can be reported, the other being defined by Vro = Voil / Vsat.
- Fluid density (Single-phase density in whitsonPVT*) - Calculated or measured, it is hard to know! But since the lab is not explicitly stating that the density is measured***, it is usually a good idea to treat it as calculated (i.e. somewhat uncertain).
- Z-factor - This is always calculated.
- Y-function - This is always calculated.
- Average compressibility - This is always calculated, and can vary significantly based on the method that is used to estimate it!
Not all the reported values are possible to store in whitsonPVT, and the reason for this is either that it is being calculated in whitsonPVT (like the Y-function), or that it is not being used for any calculation or visualization in the software.
The Y-function QC check is giving an exact straight line, which is indicating that perhaps the lab has used the results of the Y-function check to smooth the measured volumes. This is not being reported in the report, and is somewhat of a red flag. The same goes for the mass balance check, where the relative mass is being estimated based on the reported relative total volume and reported density for the undersaturated conditions. This is also a red flag that the density is calculated (assuming a constant mass and using the volume to calculate the density).
Example 2 - Sample CL-70055 (Duvernay)
This sample is a volatile oil fluid, seen by the fact that the break between the undersaturated and saturated region does not exhibit a clear break in the relative total volume data (black-oil systems have a more linear behavior at the saturated conditions).
This sample's PVT data can be found in this PVT report on page 14. Unlike Example 1, for oil samples it is very common for the laboratory to not report the relative oil volume unless it is asked. Most modern laboratories use windowed PVT cells, so we typically recommend asking the lab to also measure the relative oil volme as this data can be really useful for the fluid model development.
Hiding and adding columns in PVT experiments
In whitsonPVT you can add or hide data columns that don't have any data in them! This is shown in the animation below!
Example 3 - Sample 2.08+2.09 (Duvernay)
This sample is a slightly more lean gas condensate fluid, with a maximum liquid dropout of just below 8.5%. Unlike the fluid in Example 1, the relative oil volume is relative to the measured volume at the saturation pressure, not the total volume (i.e. Vro = Voil / Vsat), although the lab reports both relative oil volume types.
This sample's PVT data can be found in this PVT report on page 34.
Something to make note of for this experiment, is that the relative total volume is not monotonically increasing below the saturation pressure (it goes from 0.995 just above the dewpoint, to 1 at the dewpoint, to 0.991 just below the dewpoint). This is not possible and indicated that something is wrong with the reported data. This is also indicated in the Y-function QC check. The single phase mass balance is, however, not affected by this, which is strongly indicating that the reported values are calculated and not measured.
Example 4 - Sample CL-70073 (Duvernay)
Similar to the sample in Example 2, this fluid is a volatile oil. However, unlike Example 2, this sample has relative oil volume measurements. In addition to having this data, this fluid went through multiple CCE experiment at different temperatures. The resulting relative oil volumes and saturation pressures at the different temperatures are shown in Figure 1.
This sample's PVT data can be found in this PVT report on pages 16, 17, and 41 to 49.
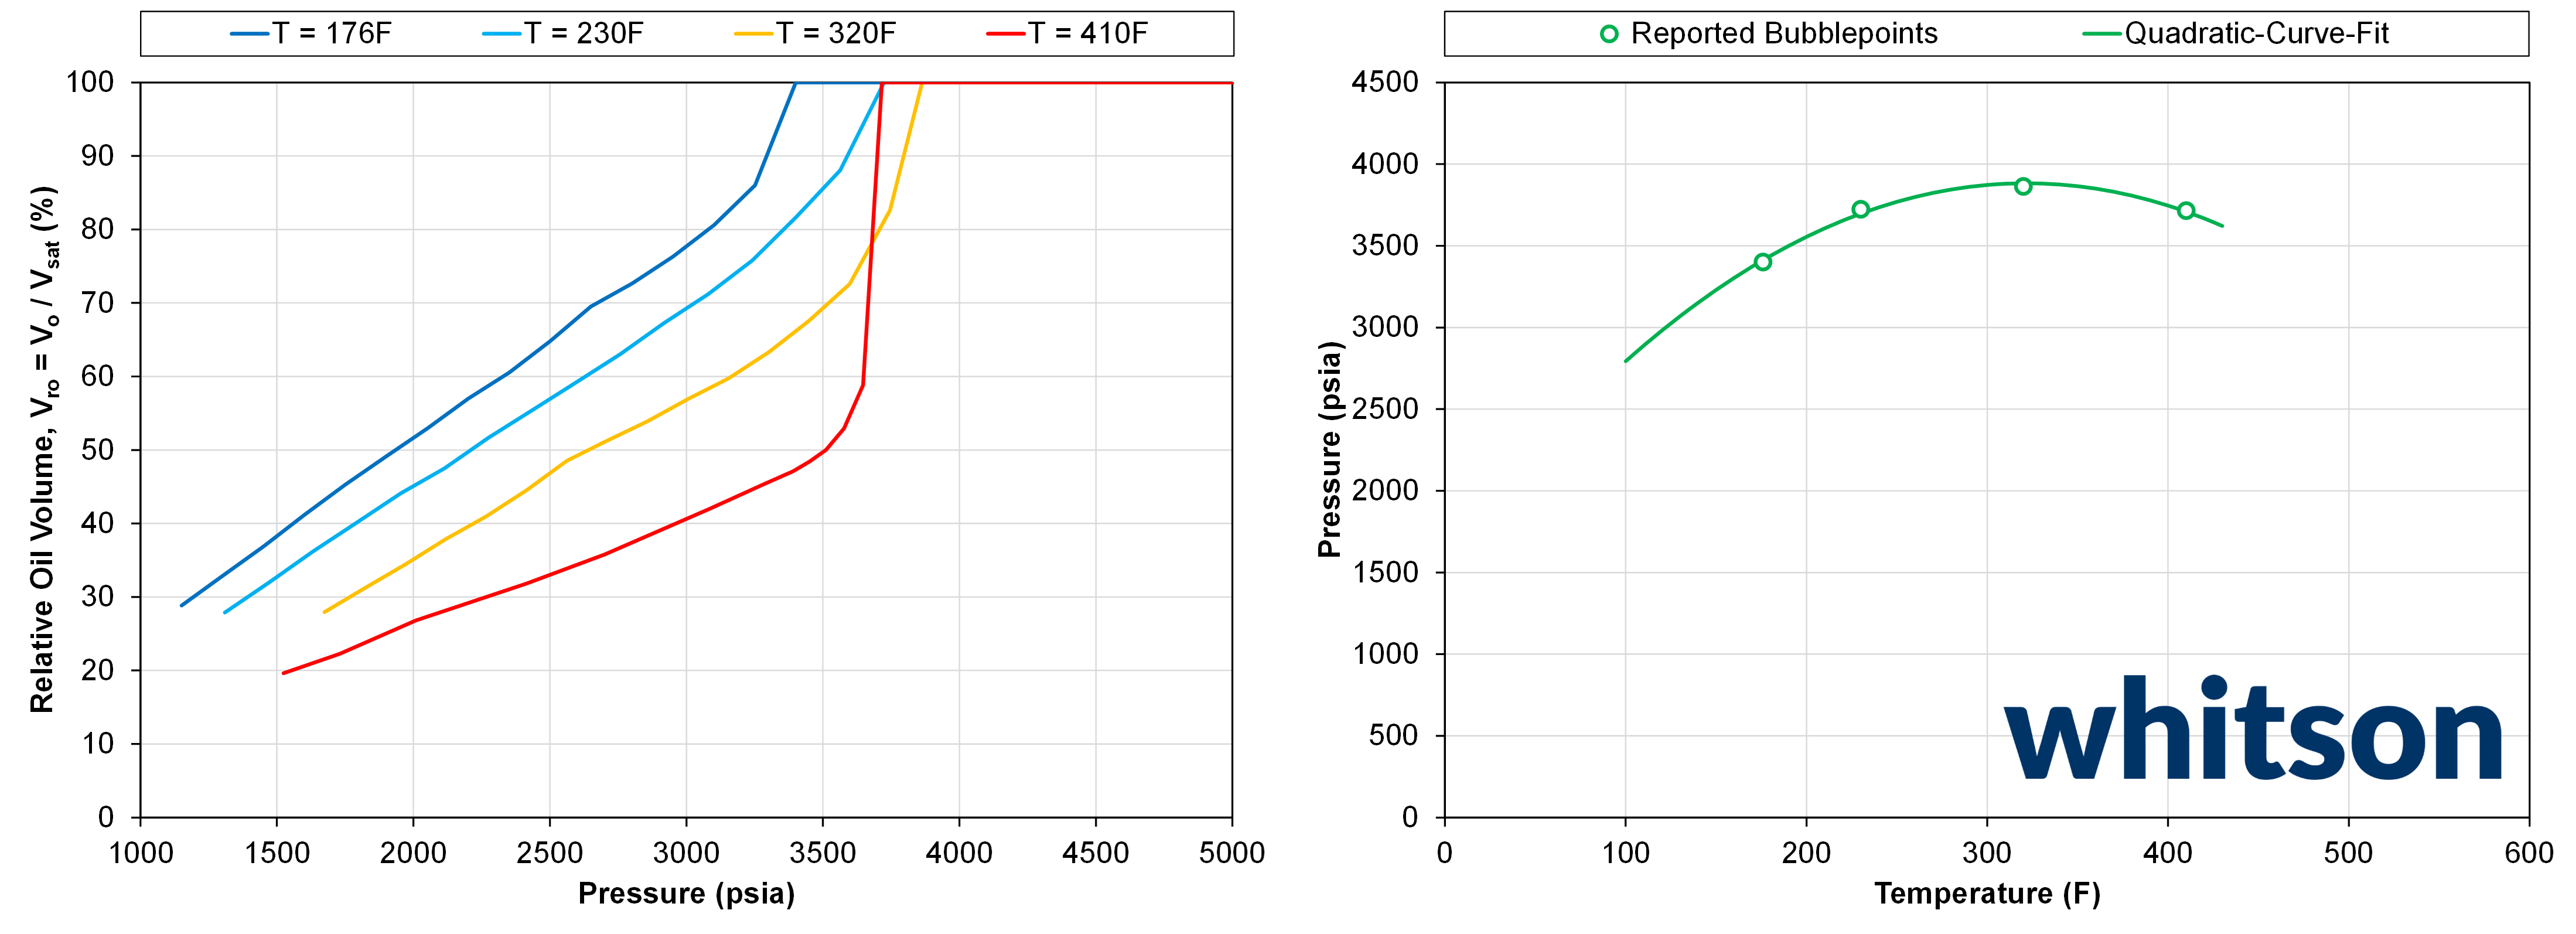
Figure 1 - The left plot shows the relative oil volume for the different CCE at different temperatures. The right plot shows the measured saturation pressures at the different temperatures and an illustrative curve fit indicating what the phase envelope might look like.
DLE Experiments
What would we recommend if this is your first time?
There are multiple "GORs" in a DLE experiment! As a rule of thumb, do not choose the "corrected values" as they are calculated, not measured.
The GORs that ends with "0" at the last stage is usually the solution GOR (Rs), while the other is the liberated gas volume!
The oil density in the DLE experiment is most likely calculated from the material balance! The residual oil density is almost always measured, and sometimes the saturation pressure density is also measured. To know for sure, check with the lab, or try to find some documentation in the PVT report.
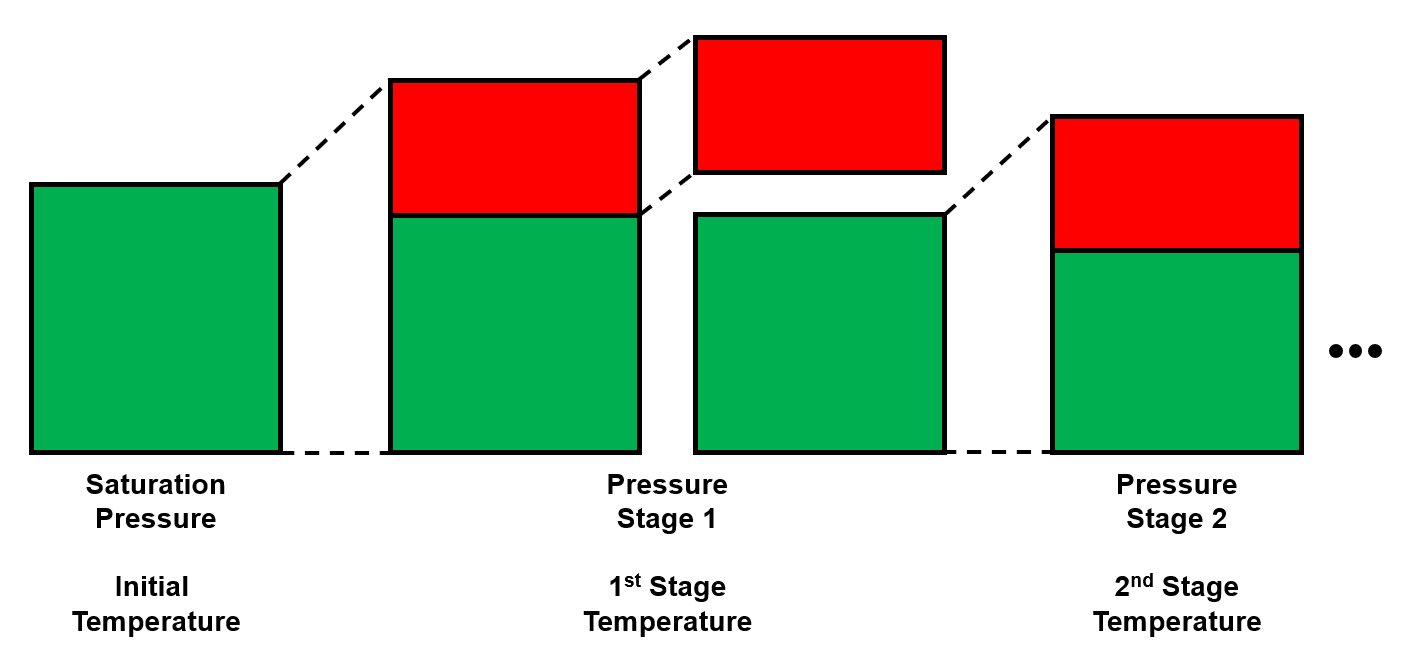
The differential liberation expansion (DLE), or sometimes called differential liberation (DL), is a common destructive PVT experiment (i.e. it has removal at each stage) for oil systems.
- Pressure - Measured.
- Removed gas volume (reported as solution GOR or liberated gas volume) - Measured.
- Oil volume (reported as oil formation volume factor) - Measured.
- Removed gas gravity - Measured.
- Removed gas composition - Usually measured and reported.
- Residual oil density - Usually measured and reported.
- Residual oil molecular weight - Usually calculated, but sometimes measured.
- Residual oil composition - Commonly measured and reported.
- Oil density - Usually calculated.
- Removed gas Z-factor - Calculated.
- Gas Specific Gravity (part of the Residual Fluids Information at Standard Conditions) - This is a special case property that is only relevant if the last stage pressure in the DLE is significantly higher than the atmospheric pressure. Some reports have this case, and there will therefore be an additional stage in the DLE that is not reported with some additional liberated gas.
Sometimes the PVT report has two sets of DLE data. The one referred to as the corrected table should not be databased as it is not measured, and is using the results of the multi-stage separator (MSS) test to adjust the oil formation volume factor and solution GOR. This data can, just like the lab cleaned composition, be ignored in the data entry. The reason for this is that the DLE data is not used directly any more to develop black-oil tables for reservoir simulation, and more accurate results will be provided by an EOS model.
Undersaturated DLE data
The DLE experiment starts at the bubblepoint, and in most (if not all) cases, if undersaturated data is given in the DLE stage data table it is copied from the CCE experiment. One easy method for checking this is to compare the pressure steps (at undersaturated conditions), and the oil density. If the values are exactly the same as the CCE data then it is usually the same data repeated twice!
Example 1 - Sample CL-70055 (Duvernay)
This sample's PVT data can be found in this PVT report on pages 15, 16, 18, and 19.
The stage data oil properties are found on page 15, while the removed gas properties are found on page 16. The following properties are given for this sample:
- Pressure - Measured directly.
- Oil formation volume factor (same name in whitsonPVT) - Estimated based on measured oil volumes.
- Gas oil ratio type: solution or liberated (Solution gas-oil ratio and liberated gas removed respectively in whitsonPVT) - Measured directly, or estimated directly from the measured removed gas volume.
- Oil density (same name in whitsonPVT) - Calculated from the backward material balance.
- Gas gravity (same name in whitsonPVT) - Measured directly.
- Gas deviation factor (Gas Z-factor in whitsonPVT) - Calculated.
- Gas formation volume factor (not in whitsonPVT) - Calculated.
- Gas expansion factor (not in whitsonPVT) - Calculated.
Some properties, like gas formation volume factor and gas expansion factor, are not databased in whitsonPVT because these are derivative properties that can easily be re-calculated from other properties. If these values are needed, they can be consistently calculated in whitsonPVT.
This sample passed all the QCs, and we can use the oil density material balance check to give an indication that these densities are calculated from the material balance! The K-values behave somewhat erratic for low pressures, and this is not uncommon. It is therefore flagged as a warning and not an error.
Example 2 - Sample CL-70073 (Duvernay)
This sample's PVT data can be found in this PVT report on pages 18, 19, 21, and 22.
This sample has the same data reported as Example 1. The key difference here is that it does not pass the backward material balance QC, resulting in a deviation of the original fluid which is more than 1 mole% for C1 and C7+. One potential reason for this is the composition measurements, or the removed gas volumes. Plotting the GOR versus oil formation volume factor should be roughtly a straight line, but in this case it deviates significantly for the second to lowest pressure. This could also be the source of error.
Example 3 - Sample TS-29-06 (Volve)
This sample's PVT data can be found in this PVT report on pages 8, 9, and 10.
The data provided for this sample is very similar to Examples 1 and 2, but also has the gas viscosity from the Lee-Gonzalez correlation. This dataset doesn't give the gas Z-factor at the last stage, as it assumes a value of 1 here (i.e. an ideal gas).
CVD Experiments
What would we recommend if this is your first time?
Make sure to put in all the data that you can, also the compositional data! The compositional data can be used to estimate the OGR versus material balance time, which is a key production metric for gas condensate fields.
The constant volume depletion (CVD), is a common destructive PVT experiment (i.e. it has removal at each stage) for gas condensates, near-critical, and volatile oil systems.
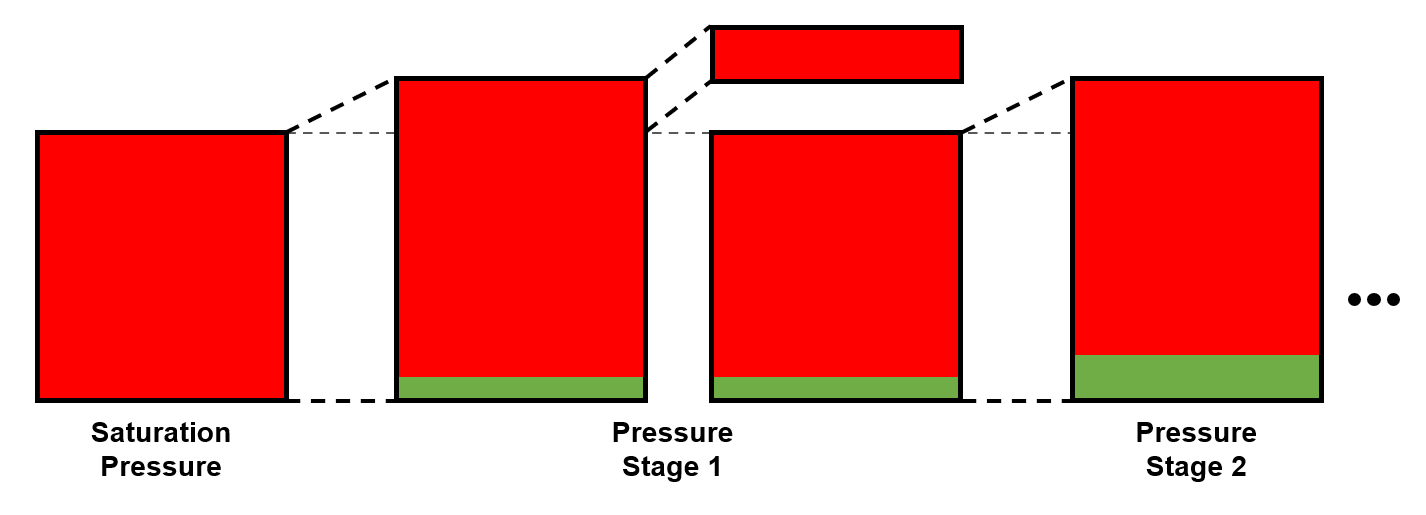
- Pressure - Measured directly.
- Relative oil volume - Estimated from the measured oil volume and measured total volume.
- Relative moles removed - Estimated from the removed quantity.
- Gas gravity - Measured directly.
- Gas Z-factor - Calculated.
- Gas viscosity - Calculated.
- Gas heaviest fraction molecular weight - Calculated.
- Oil density - Calculated.
Undersaturated CVD data
The CVD experiment starts at the saturation pressure, and in most (if not all) cases, if undersaturated data is given in the CVD stage data table it is copied from the CCE experiment. One easy method for checking this is to compare the pressure steps (at undersaturated conditions), and the oil density. If the values are exactly the same as the CCE data then it is usually the same data repeated twice!
Example 1 - Sample 2.08+2.09 (Duvernay)
This sample's PVT data can be found in this PVT report on pages 37, 40, and 41.
The stage data properties are found on page 37, while the compositional data are found on pages 40 and 41. The following properties are given for this sample:
- Pressure - Measured directly.
- Total recovery (relative moles removed in whitsonPVT) - Estimated from the removed amounts of gas.
- Liq. volume (relative oil volume in whitsonPVT) - Estimated from the measured oil volume and the constant cell volume.
- Vapor density (gas gravity in whitsonPVT, but the unit is g/cm3 not SG) - Measured directly.
- Vapor mole composition (liberated gas in whitsonPVT) - Measured directly.
- Last stage liquid mole composition (residual oil in whitsonPVT) - Estimated from the measured mass composition using table value molecular weights.
- Gas Z-factor (same as in whitsonPVT) - Calculated.
- Gas viscosity (same as in whitsonPVT) - Calculated.
- Liquid density (oil density in whitsonPVT) - Calculated or measured directly.
- Vapor MW - Not reported in whitsonPVT
- 2-phase Z-factor - Not reported in whitsonPVT
Running the QC for this experiment, it seems like the data quality is pretty good. The backward material balance is acceptable, but the calculated liquid density deviates significantly. The K-value data indicates that there is some inconsistency in either the compositional data or the removed quantities. For this case, we would not recommend using the compositional data as part of the EOS Tuning.
Example 2 - Sample CL-63169 (Duvernay)
This sample's PVT data can be found in this PVT report on pages 7, 8, 9, and 10.
The stage data properties are found on pages 7 and 8, while the compositional data are found on pages 9 and 10. The following properties are given for this sample:
- Pressure - Measured directly.
- Cumulative produced fluid (relative moles removed in whitsonPVT) - Estimated from the removed amounts of gas.
- Cumulative liquid recovery (relative oil volume in whitsonPVT) - Estimated from the measured oil volume and the constant cell volume.
- Gas density (gas gravity in whitsonPVT, but the unit is g/cm3 not SG) - Measured directly.
- Produced wellstream mole composition (liberated gas in whitsonPVT) - Measured directly.
- Gas deviation factor (same as in whitsonPVT) - Calculated.
- Gas viscosity (same as in whitsonPVT) - Calculated.
- 2-phase gas deviation factor - Not reported in whitsonPVT
For some reason the laboratory does not report the residual oil composition. This significantly reduces the number of QCs that can be applied to the experiment.
MSS Experiments
What would we recommend if this is your first time?
The last stage of the MSS should be at or near surface conditions, so make sure that you add all the data here! If not the QCs will not work correctly.
There are multiple "GORs" in a MSS experiment! As a rule of thumb, do not choose the "corrected values" as they are calculated, not measured.
The GORs that ends with "0" at the last stage is usually the solution GOR (Rs), while the other is the liberated gas volume!
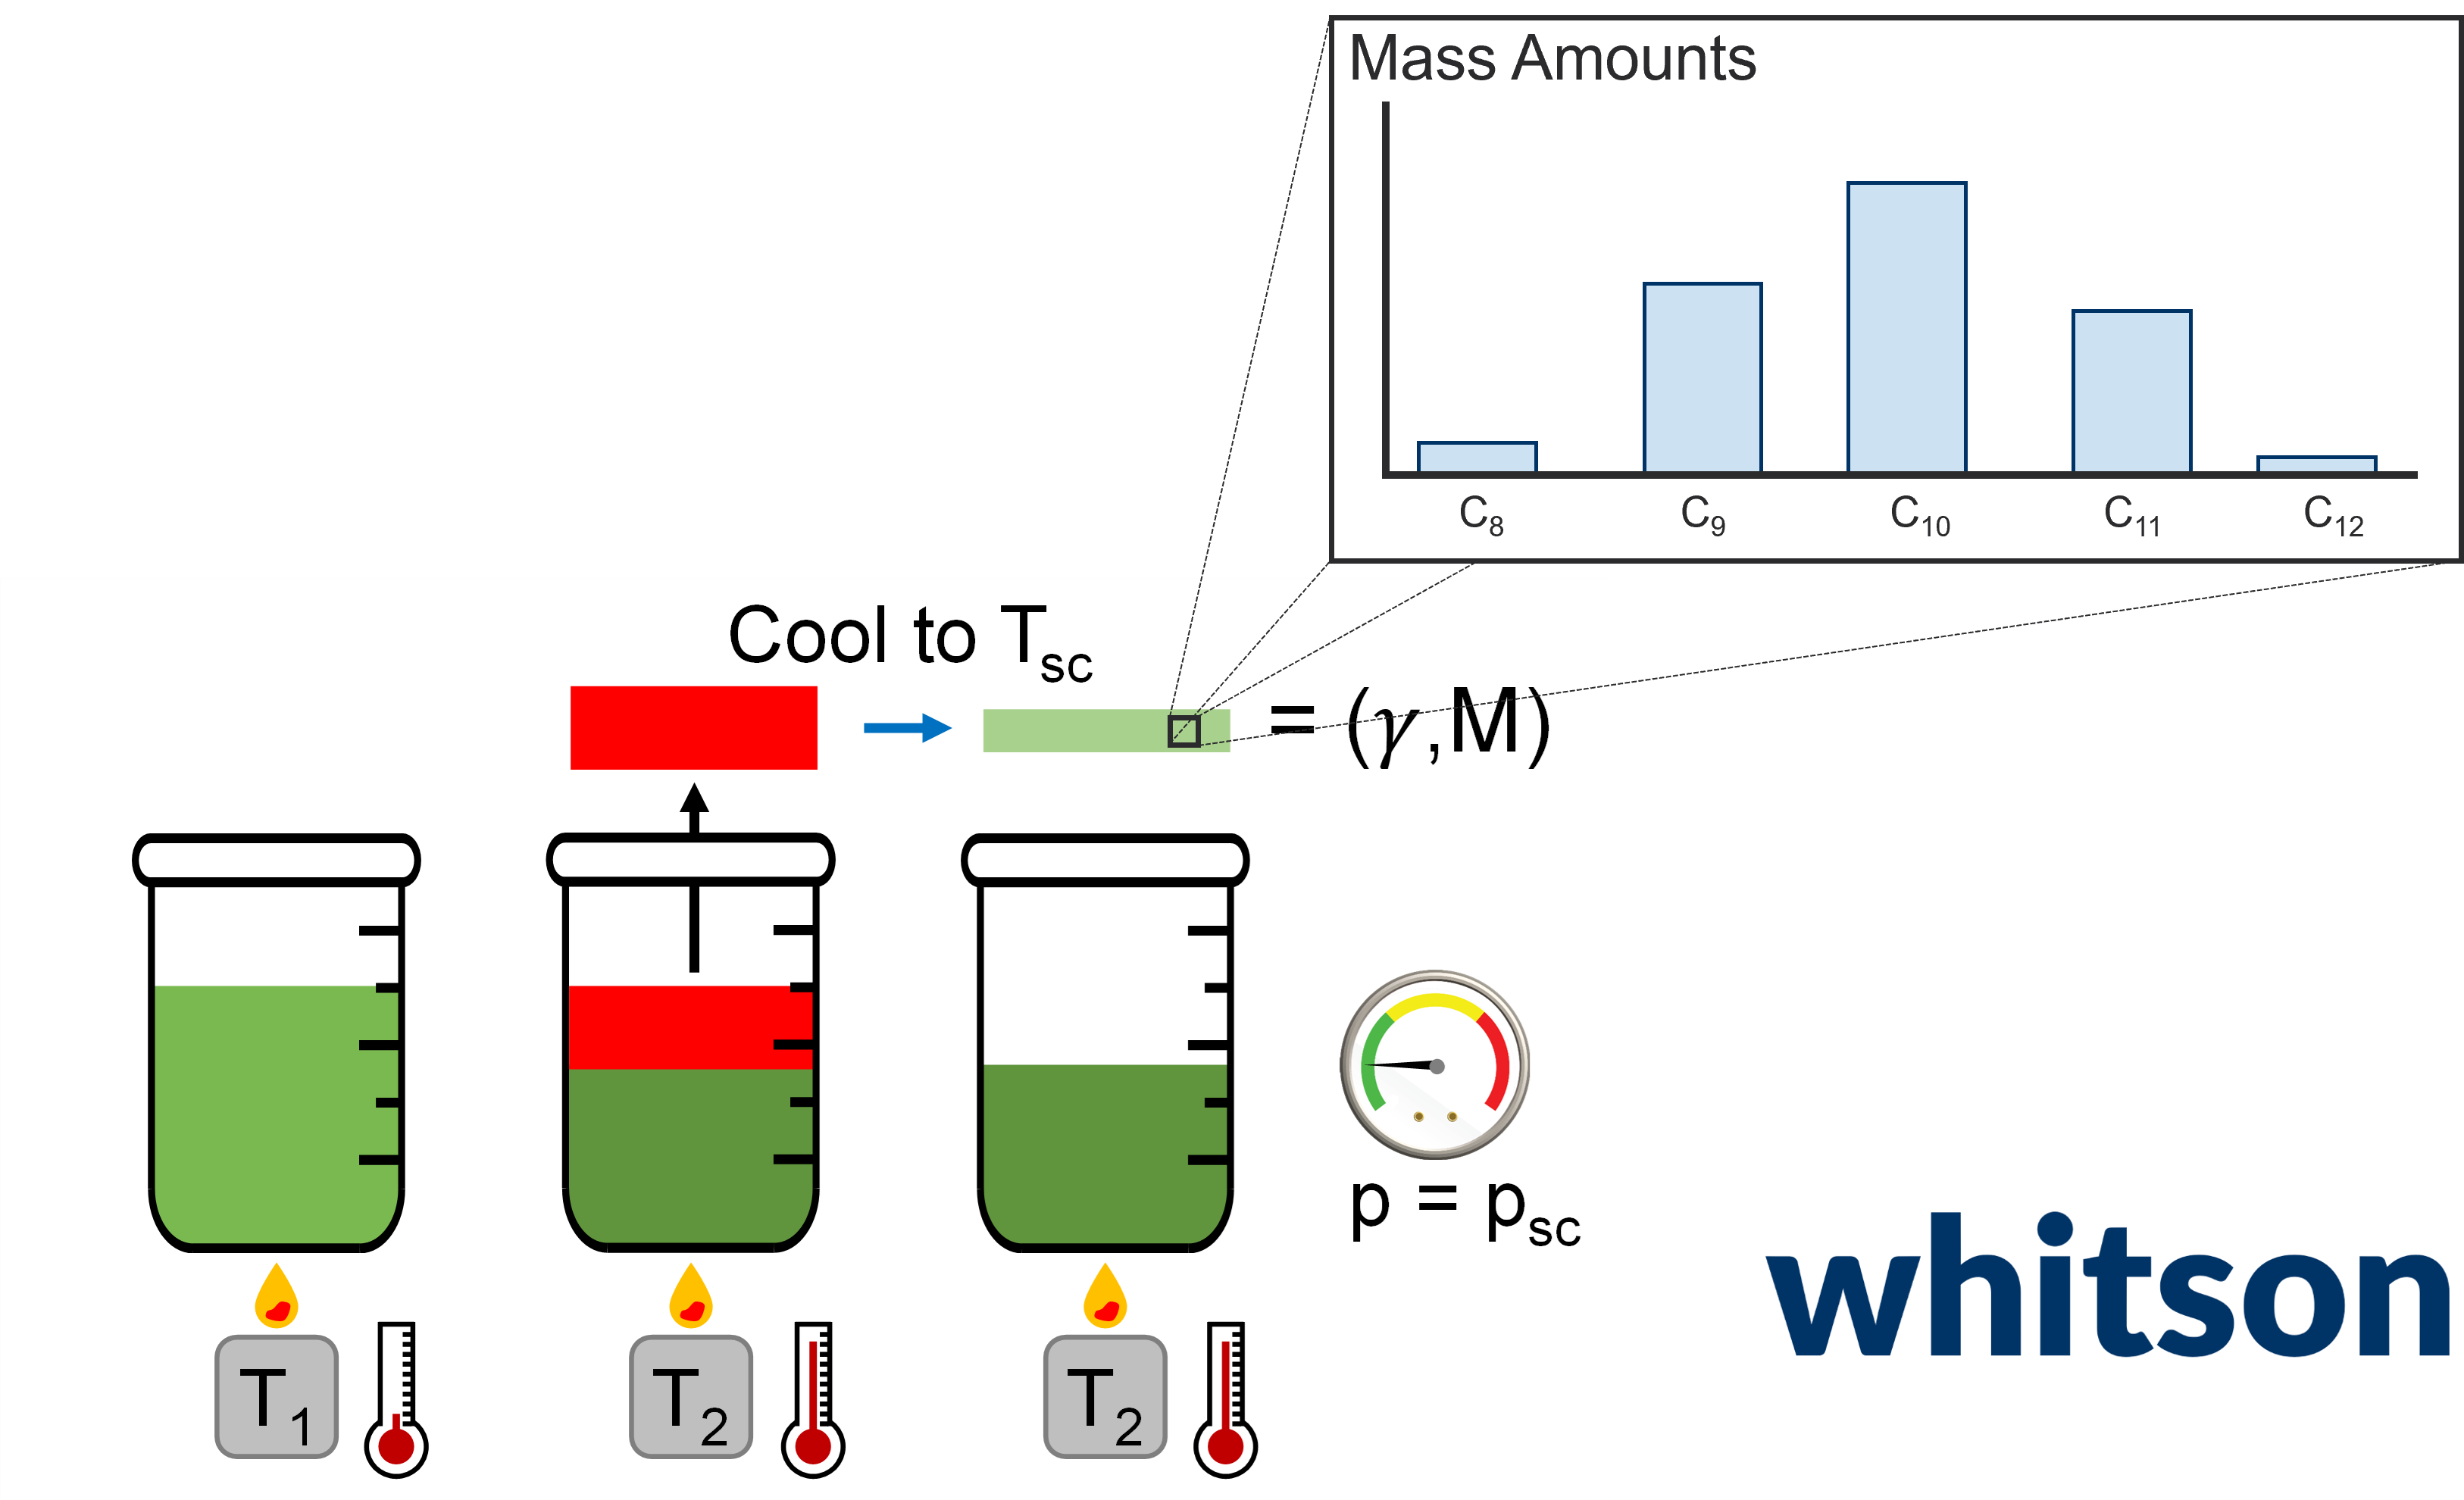
The multi-stage separator (MSS), or sometimes called multistage separator test (MST), is a common destructive PVT experiment (i.e. it has removal at each stage) for oil, gas condensate, and wet gas systems.
The data in the MSS experiment is almost exactly the same as for the DLE experiment except for temperature is also an input, and instead of the solution GOR being the most commonly reported value, the liberated gas removed is the most commonly reported value. The formation volume factor at the saturation pressure might not be reported, or reported in a separate column as the the total fluid formation volume factor. The reason for this is that the reservoir fluid type that MSS experiment are conducted for are not always oils, but also gas condensate and wet gas fluids.
MSS last stage condition - It needs to be at surface conditions!
The last stage of the MSS experiment should be near or at surface conditions! If this is not the case in the stage data table, the relevant properties like stock tank oil density, oil formation volume factor, etc. might be reported other places. If the last reported stage is at surface pressure and a temperature above surface temperature, the lab might assume that the formation volume factor is 1, the last stage (i.e. only cooling) will not release any gas (i.e. liberated gas removed is 0), etc.. We still recommend that you fill these assumed values in to be able to run the QCs.
Example 1 - Sample 6103-MA from well 15/9-F4 (Volve)
This sample's PVT data can be found in this PVT report on pages 29, 30, 31, and 32.
The stage data properties are found on page 29. The compositional data are found on pages 30, 31, and 32. The following properties are given for this sample:
- Pressure - Measured directly.
- Bo (oil formation volume factor in whitsonPVT) - Estimated based on measured oil volumes.
- Gas released (liberated gas removed in whitsonPVT) - Measured directly.
- Rs (solution gas-oil ratio in whitsonPVT) - Estimated directly from the measured removed gas volume.
- Density of satured fluid (oil density in whitsonPVT) - Calculated from the backward material balance.
- Gas gravity (same name in whitsonPVT) - Measured directly.
Going to the data QCs, this experiment's data looks like it had high quality! All material balance check pass with an acceptable degree of accuraccy. There is a typo in the PVT report for the last stage oil formation volume factor, which should be 1, but is set to the initial volume factor (1.362). Changing this value makes all the QCs fall in place!
Example 2 - Sample CL-70073 (Duvernay)
This sample's PVT data can be found in this PVT report on pages 34, 35, 36, and 37.
The stage data oil properties are found on page 34, while the stage data gas properties are found on page 35. The compositional data are found on pages 36, and 37. The following properties are given for this sample:
- Pressure - Measured directly.
- Bo (oil formation volume factor in whitsonPVT) - Estimated based on measured oil volumes.
- Gas released (liberated gas removed in whitsonPVT) - Measured directly.
- Rs (solution gas-oil ratio in whitsonPVT) - Estimated directly from the measured removed gas volume.
- Density of satured fluid (oil density in whitsonPVT) - Calculated from the backward material balance.
- Gas gravity (same name in whitsonPVT) - Measured directly.
Viscosity Experiments
What would we recommend if this is your first time?
The basis experiment used to make the measurements for the viscosity experiment can have a significant impact on the predictions. The standard is to assume that the DLE experiment is used, but this is not always the case. For example, for reservoir gas systems, it would not make sense to use a DLE experiment.
The uncertainty for oil viscosity can sometimes be quite significant! There are maany factors that can play a role here, like the velosity of the measurement tool, a possible bleeding process for the last stages in the DLE experiment, and calibration issues. We have seen cases where the deviation for the same fluid sample where the viscosity has been measured twice independently of each other, deviating up to 25-35%.
The viscosity experiment (VISCO) is a common PVT experiment for oil systems, and sometimes also for gas condensate systems.
- Pressure and volume - Measured.
- Oil viscosity - Estimated from the measured (or estimated) kinematic viscosity.
- Gas viscosity - Almost always calculated using the Lee-Gonzalez correlation.
- Oil-Gas viscosity ratio - Not reported in whitsonPVT.
Example 1 - Sample CL-70055 (Duvernay)
This sample's PVT data can be found in this PVT report on page 17. The data is reported as coming from a DLE experiment. The gas viscosity is coming from the Lee-Gonzalez correlation.
Example 2 - Sample CL-70073 (Duvernay)
This sample's PVT data can be found in this PVT report on page 20. Just like Example 1, the data is reported as coming from a DLE experiment. The gas viscosity is coming from the Lee-Gonzalez correlation.
Example 3 - Sample TS-29-06 from well 15/9-19SR (Volve)
This sample's PVT data can be found in this PVT report on page 11. It is not reported what experiment was used when measuring the viscosity, so the recommended experiment basis is the DLE experiment as a DLE was performed for this sample, and the fluid type is an oil. No gas viscosity was reported. The viscosity measurement was performed using a rolling ball viscosimeter, which is based on the falling ball principle.
Distillation Data
Don't know if you have distillation data?
Very commoly, the distillation data (usually kept with the downstream team) is kept by a separate department from the standard PVT reports (usually kept with the upstream team). If you ask around, you might find that you have a lot more useful data available, especially in the case of distillation data!
Distillation data, sometimes called True Boiling Point (TBP), crude assay data, or crude value assesment (CVA) distillation is usually not assosiated with PVT experiments, but it can be a really useful dataset to develop a consistent multi-fluid fluid model!
The distillation experiment (TBP) is performed for produced oil samples, usually comingled streams downstream in the flowline. The most relevant data measured in this experiment is given below:
- Temperature bound (upper or lower) - Measured property that indicates what the bounding temperature is for a given distillation cut.
- Distillation Cut Density - Measured or estimated. Usually converted to be at some constant reference conditions of 15C and 1 atm. Themal expansion is usually applied for heavier cuts that might become solid (and start cracking) at surface conditions.
- Produced mass amounts - Measured or calculated (the residual mass amount is very often back-calculated).
- Distillation Cut Molecular Weights - Measured if they are reported. These can be really useful, so we recommend asking for getting these measured even though the cost is slightly higher!
- Volume amounts - Measured or calculated (depending on the temperature for the cut, the temperature might not be at surface conditions).
Example 1 - From well 15/9-19SR (Volve)
Don't want to digitize the data from the report? Download the Excel file here!
You can access an Excel file here that has the data digitized in the format that you should enter it in whitsonPVT!
The distillation data report for this wellstream's crude oil can be found here. The PVT sample meta data is given below.
PVT Sample Information
-
Sample Name: A-15392
-
Sample Type: Flashed oil
-
Well Name: 15/9-19SR
-
Sample Date: 1993-04-21
-
Reservoir (Segment): Volve
-
Formation (Zone): Hugin
PVT Sample Location Information
-
Top Perforation Depth: 4316 mMD (RKB)
-
Bottom Perforation Depth: 4338 mMD (RKB)
PVT Sample Conditions Information
-
Pressure when Sampled: 52.3 bara (separator conditions)
-
Temperature when Sampled: 52.5C (separator conditions)
The distillation data is given on pages 8, 9, 10, and 11. The composition composition is taken from the extended GC data given on page 13 for the C9- components, and from page 14 for C10+. Since we need to know the residual fraction MW as an input to whitsonPVT, we stop the composition at C20+ and use the M20+ from page 11. Component molecular weights are taken from page 13 for the C9- components. The cut temperature is taken from column directly next to the fractions column on page 8. These temperatures are upper temperatures, but we input them as lower temperatures shifted one row down. The first temperature can be arbitrarily set to 0 (approximate normal boiling point for n-C4). The weight fractions for C5+ is input from page 8 (skipping the C10+ row). The density and volume fractions for C5+ is input from page 9 (skipping the C10+ row). The molecular weights for C5+ is input from page 10 (skipping the C10+ row).
Page 12 shows how much the neighbouring cuts are contaminating the induvidual distillation cuts based! Starting from C10, the distillation experiment becomes highly contaminated with its neighbouring cuts. This will add some uncertainty to the specific gravity vs molecular weight relationship. This is the reason why the normalized mass composition for the C5+ components is different from the distillation experiment and the extended GC data.
Example 2 - From well 15/9-19A (Volve)
Don't want to digitize the data from the report? Download the Excel file here!
You can access an Excel file here that has the data digitized in the format that you should enter it in whitsonPVT!
The distillation data report for this wellstream's crude oil can be found here. The PVT sample meta data is given below.
PVT Sample Information
-
Sample Name: 50257X
-
Sample Type: Flashed Oil
-
Well Name: 15/9-19A
-
Sample Date: 1997-10-31
-
Reservoir (Segment): Volve
-
Formation (Zone): Hugin
PVT Sample Location Information
-
Top Perforation Depth: 3021.2 mTVD (ss)
-
Bottom Perforation Depth: 3056.3 mTVD (ss)
PVT Sample Conditions Information
-
Pressure when Sampled: 13.0 bara (separator conditions)
-
Temperature when Sampled: 59.2C (separator conditions)
The distillation data is given on pages 8, and 9. The composition composition is taken from the extended GC data given on page 11 for the C9- components, and from page 12 for C10+. Since we need to know the residual fraction MW as an input to whitsonPVT, we stop the composition at C20+ and use the M20+ from page 9. Component molecular weights are taken from page 11 for the C9- components. The cut temperature is taken from column directly next to the fractions column on page 8. These temperatures are upper temperatures, but we input them as lower temperatures shifted one row down. The first temperature can be arbitrarily set to 0 (approximate normal boiling point for n-C4). The weight fractions for C5+ is input from page 8 (skipping the C10+ row). The density and volume fractions for C5+ is input from page 8 (skipping the C10+ row). The molecular weights for C5+ is input from page 8 (skipping the C10+ row).
Next Step
If you have gone through this data digitalization certification process, congratulations 🎉! You are now certified for data digitalization in whitsonPVT! To get your cetificate, go to this link and follow the instructions!
The next step is to develop a detailed fluid model!