Getting Started with whitsonPVT
What would we recommend if this is your first time?
Try to enter as much data as possible! The more data you enter, and analyze the results of, the better understanding you'll get!
The goal of this and the following sections is to help you learn how to use whitsonPVT and learn how to navigate the world of PVT data, modeling, and predictions. Each section will focus on different important aspects within the world of PVT. At the end of each section you are able to send us an email at support.pvt@whitson.com to get certified for the specific topic! Throughout the different sections, real data from different fluid systems around the world will be used to give an authentic user experience, and to maximize the learning.
The different topics that are covered in the following sections are:
-
Data digitalization - This section focuses on the different aspects of PVT data digitilization and the challenges learnings associated to extracting useful data from PVT reports. This section also touches on the QA/QC features and what to look out in the compositional and PVT data.
-
Fluid model development - In this section you will develop a C7+ characterized, tuned EOS model with a detailed composition slate, and an assosiated viscosity model that can accurately predict gas and liquid viscosity.
-
Child model development - In this section you will develop consistent and accurate child models (black-oil tables and lumped EOS models) from a detailed parent fluid model.
-
Virtual PVT lab - In this section you will learn about the several different phase behavior calculations like the flash calculation, phase envelope, and how to validate an already existing fluid model with new PVT sample data.
Do you have any questions or comments? Feel free to reach out to our support email: support.pvt@whitson.com.
First things first!
The first thing you should do to get started with the certification is to make a new field that you will be working in! How this is done is shown in the animation above! A good naming convention for this section can be "[date]-[insert your name here]-Certification-Field", for example "20240408-Markus-Nielsen-Certification-Field". Since we're going to be adding data from the Duvernay basin, we can classify the field as unconventional.
PVT Datasets
What would we recommend if this is your first time?
Do you have your own data? Try entering the data we provide first, then try to find similar data from your own database, and add it and see the differences and similarities!
Throughout the different examples in the following sections, real compositional and PVT data will be utilized. The reason why we use real data is to give you a better feel for what it will actually be like to deal with lab reported data, both new and old. The disadvantage with this, although the hard truth of dealing with real data, is the added complexity of not knowing what is good / bad data versus good / bad modeling predictions!
The datasets that are going to be used are summarized below, and are from the following fluid regions:
-
Duvernay basin (whitson donated data)
-
Volve field (Equinor donated data - open source)
Duvernay Basin
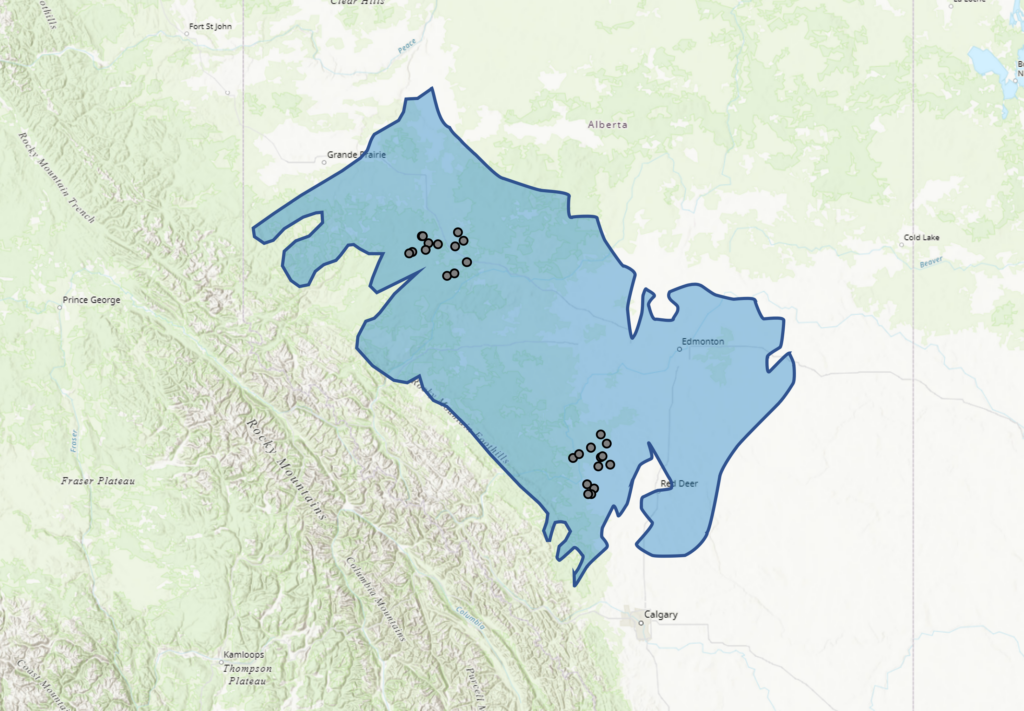
Figure 1 - Overview of Duvernay basin and locations of wells with PVT data.
The Duvernay formation is an unconventional tight rock basin located in western Canada. The fluid system in the Duvernay basin ranges from somewhere between a black-oil to a slightly volatile oil (north-east), to a relatively lean gas condensate (south-west). Some of the major fields or areas in the Duvernay basin are:
- Willesden Green (south)
- Wahigan (central)
- Saxxon (central)
- Kaybob (central)
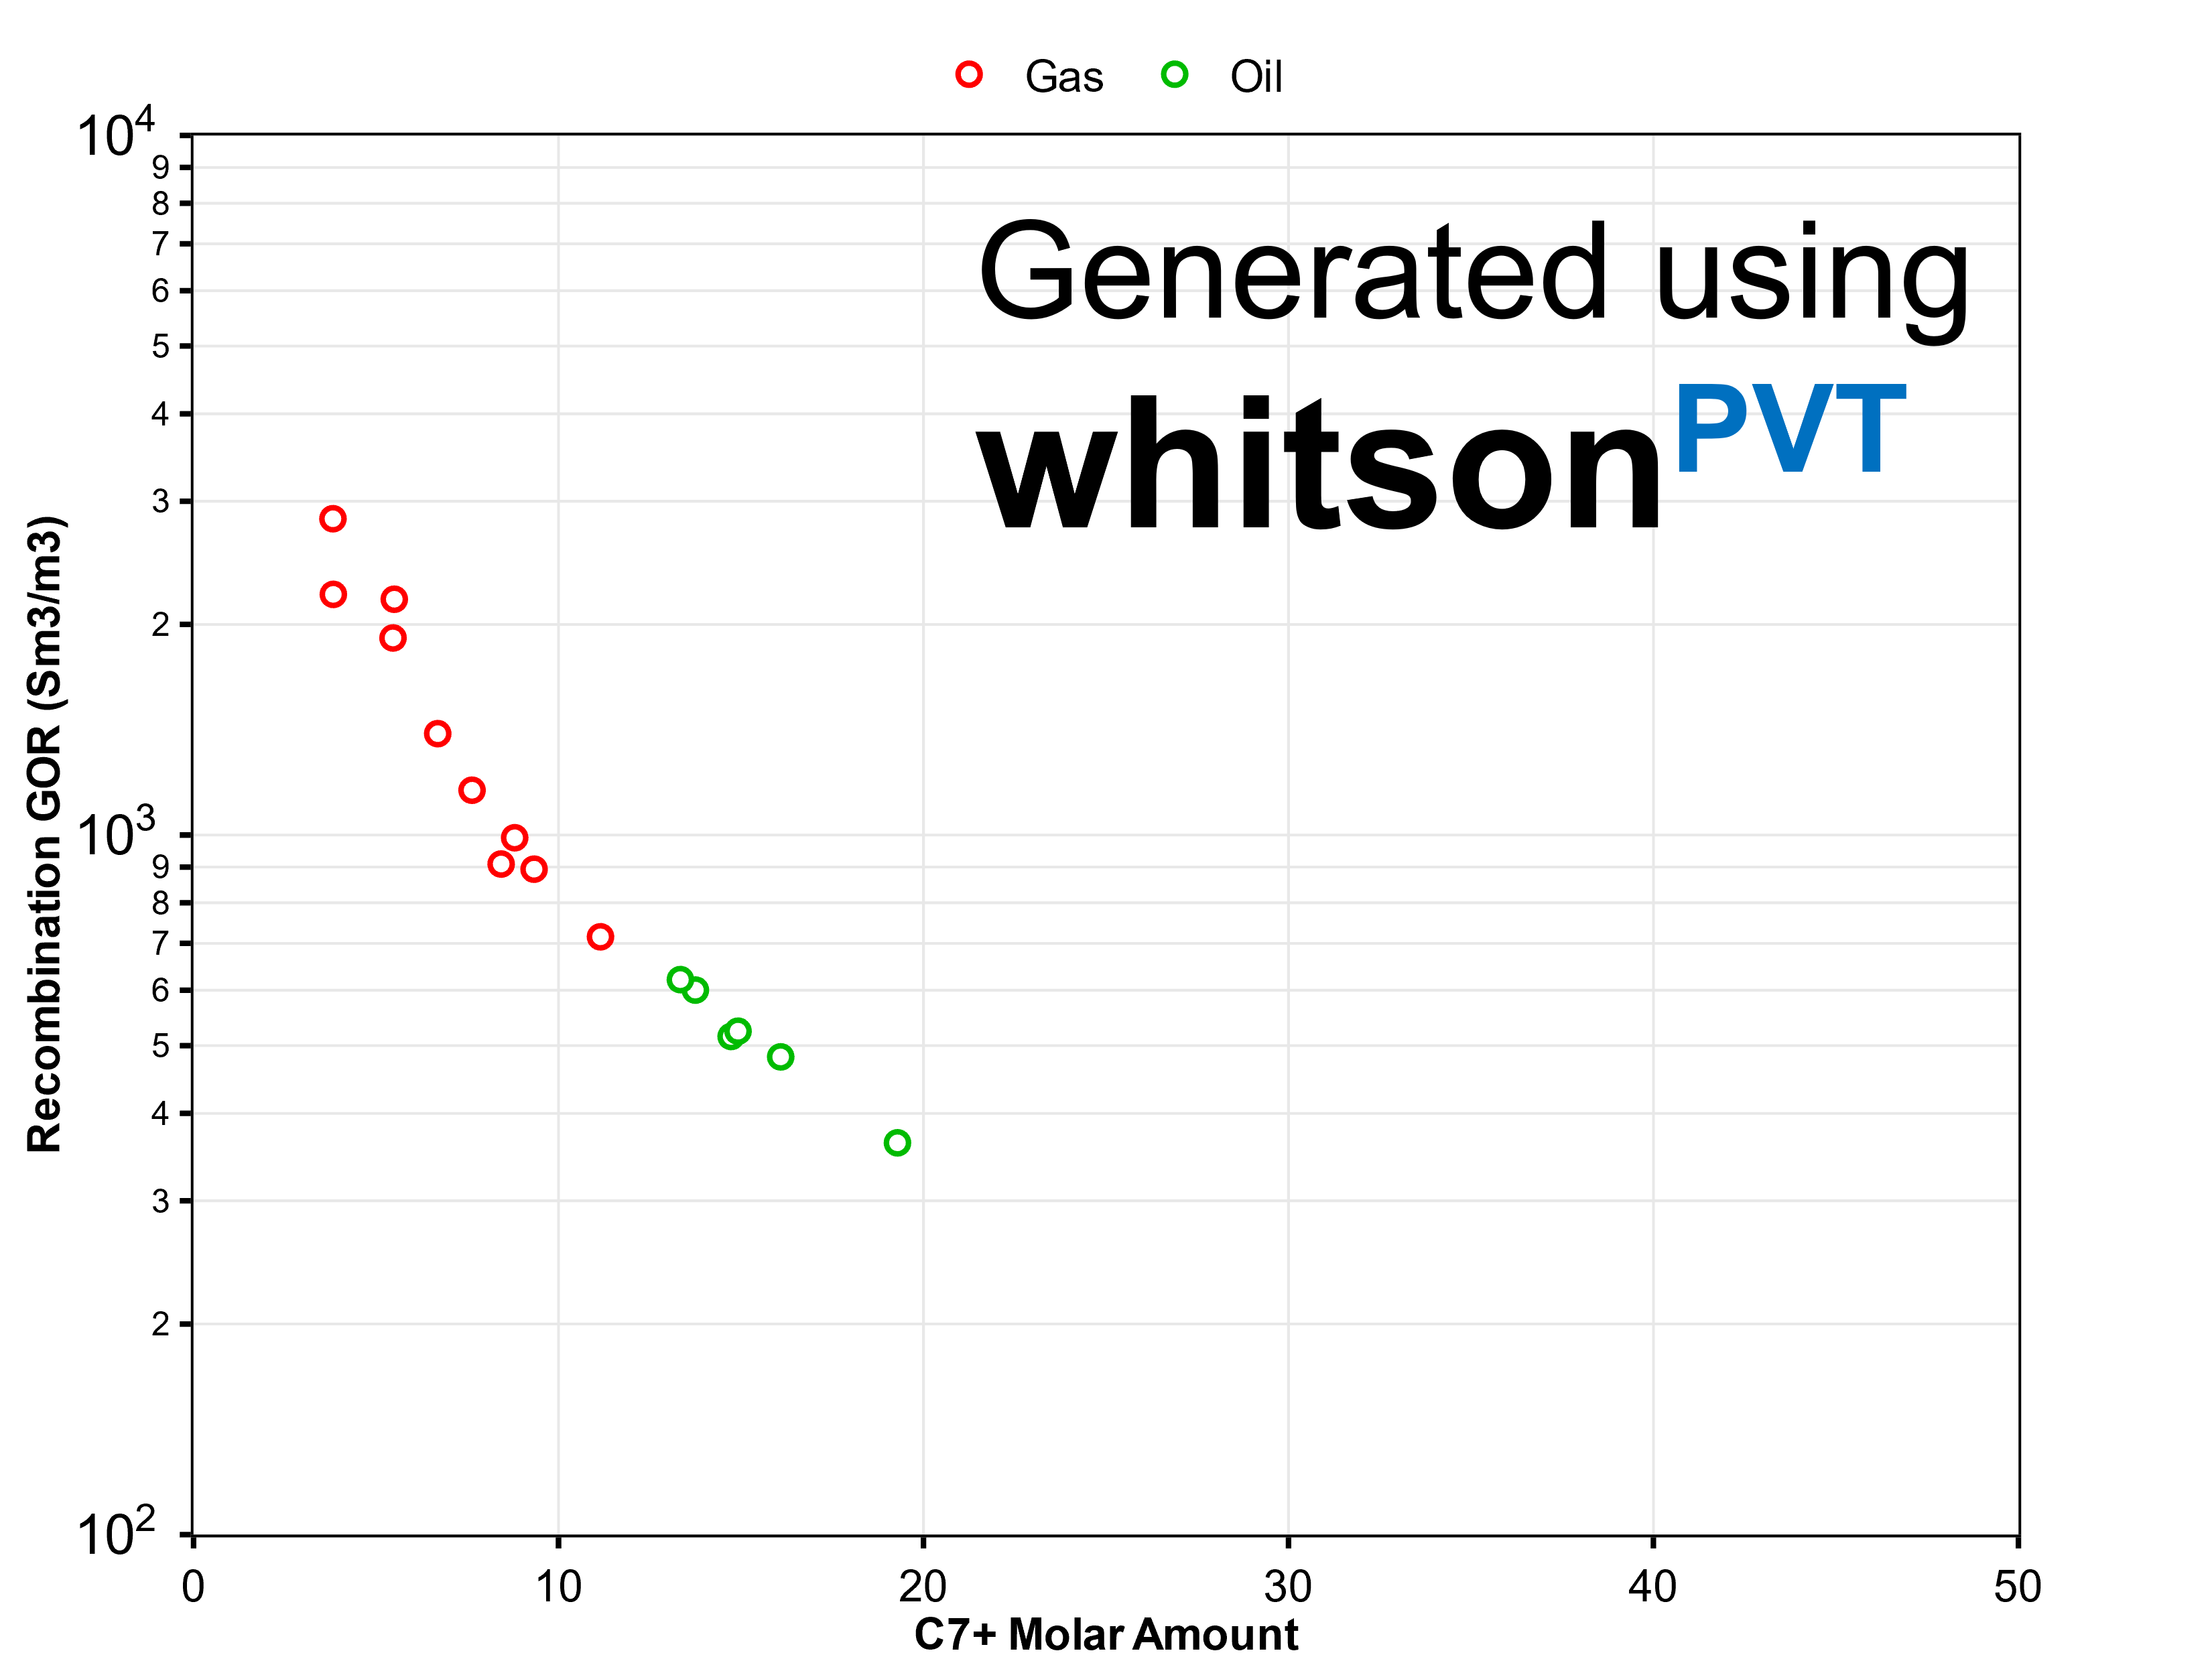
Some overall information about the compositional and PVT properties of the Duvernay dataset that we have access to is summarized below.
- Reservoir fluids range from lean gas condensate to black-oil.
- Reported recombination GORs ranging from 2038 to 15902 scf/STB (363 to 2832 Sm3/Sm3).
- Reported C1 mole content ranging from 48.2 to 72.6 mole%.
- Reported C7+ mole content ranging from 3.82 to 19.3 mole%.
- Liquid API density ranging from 59.7 to 48.3°API (0.740 to 0.787 g/cm3).
The available PVT data in the whitson database (available for all whitsonPVT subscribers, where a subset is given below) is summarized below.
- 15 standard PVT reports
- 15 recombined samples, and 1 separator recombined sample
- 75 separator oil samples
- 46 standard PVT conventional (CCE, MSS, DLE, CVD)
The free available data is given below (for the rest, contact us at support.pvt@whitson.com):
- Sample CL-63169 - Data is available here.
- Surface recombined sample (gas condensate sample).
- Recombined composition (mass+mole amounts), flashed gas (mole amounts), and flashed oil (mass+mole amounts).
- BTEX components reported for C7, C8, and C9.
- PVT Experiments: CCE, CVD, MSS.
- Additional samples: 2 flashed oil, 8 separator oils, 10 separator gases.
- Sample 2.08+2.09 - Data is available here.
- Separator recombined sample (gas condensate sample).
- Recombined composition (mass), separator gas (mole+mole amounts), recombined separator oil (mole+mole amounts), flashed gas from separator oil (mole+mole amounts), and flashed oil from separator oil (mass+mole amounts).
- BTEX components reported for C7, C8, and C9.
- PVT Experiments: CCE, CVD.
- Additional samples: SSF recombined, 4 separator oils, 7 separator gases.
- Sample CL-70055 - Data is available here.
- Surface recombined sample (volatile oil sample).
- Recombined composition (mole+mole amounts), flashed gas (mole amounts), and flashed oil (mass+mole amounts).
- BTEX components reported for C7, C8, and C9.
- PVT Experiments: CCE, DLE, and viscosity.
- Additional samples: 1 separator oil, 1 separator gas.
- Sample CL-70073 - Data is available here.
- Surface recombined sample (volatile oil sample).
- Recombined composition (mole+mole amounts), flashed gas (mole amounts), and flashed oil (mass+mole amounts).
- BTEX components reported for C7, C8, and C9.
- PVT Experiments: CCEx5, DLE, MSS, and viscosity.
- Additional samples: 1 separator oil, 1 separator gas.
Volve Field
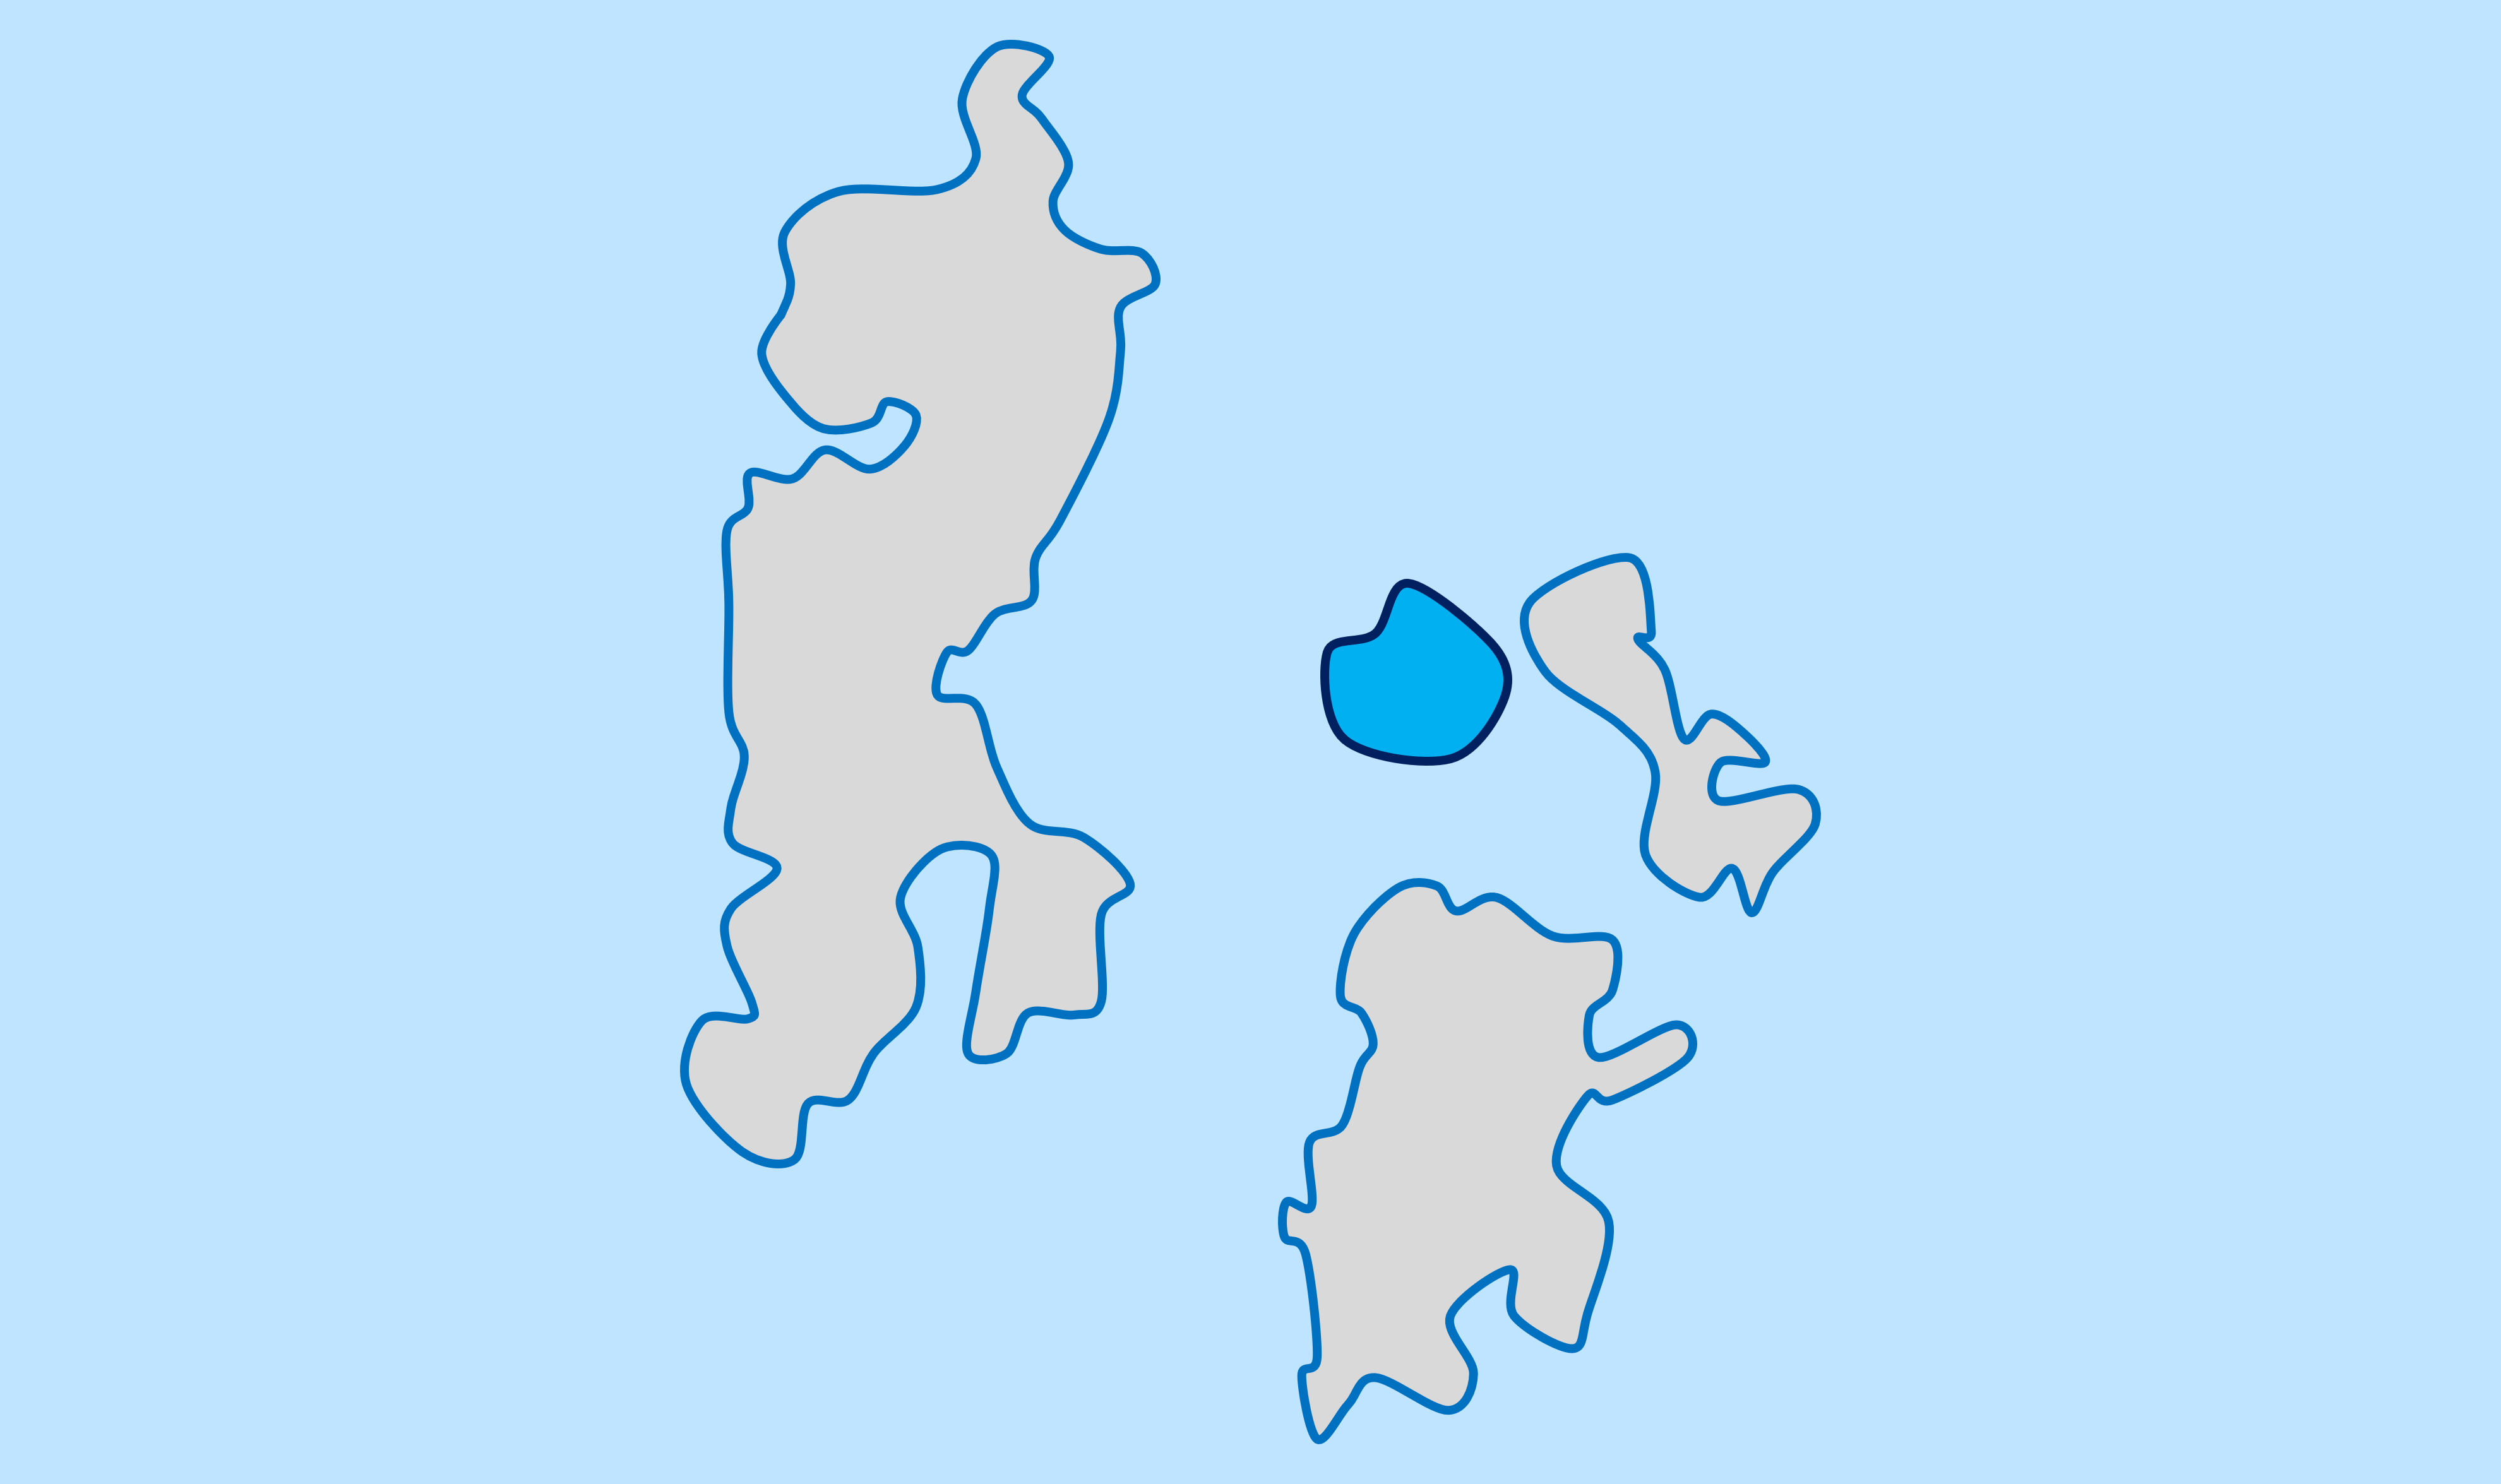 Figure 3 - Overview of Volve field (dark blue border), and neighboring fields (grey fill) Sleipner West, and Sleipner East.
The Volve field is a relatively small field in between the well known Sleipner fields (West and East) on the Norwegian continental shelf (NCS), with a maximum yearly production of about 2.8 million Sm3 oil equivalents. The Volve dataset was made public by Equinor in 2018. Along with this massive data liberation effort, the PVT data was also released! This is an amazing test data set and can / should be used as a base case for any PVT software! A limited analysis of the conventional PVT data is covered in this blog post, but there is more useful sources of data that can help characterize and develop a detailed set of fluid models (parent-child models) for the Volve field.
Some overall information about the compositional and PVT properties of the Volve field is summarized below.
- Reservoir fluids are black-oil fluids.
- Reported recombination GORs ranging from 616.5 to 893.3 scf/STB (109.8 to 159.1 Sm3/Sm3).
- Reported C1 mole content ranging from 37.5 to 43.5 mole%.
- Reported C7+ mole content ranging from 39.6 to 31.8 mole%.
- Liquid API density ranging from 30.7 to 28.7°API (0.8725 to 0.883 g/cm3).
The available PVT data for Volve is summarized below:
- 12 PVT reports
- 4 standard PVT reports
- 2 distillation reports
- 2 MMP reports, 1 swelltest report, and 1 interfacial tension (IFT) reports
- 1 wax appearance temperature (WAT) report, and 1 trace elements report
- 15 samples with compositional data
- 13 conventional PVT experiments (CCE, MSS, DLE, viscosity)
The available data is given below:
- Well 15/9-19SR
- Well 15/9-19A
- Standard PVT report 1 (1998) is available here.
- Standard PVT report 2 (1998) is available here.
- Distillation data report (1998) is available here.
- Swelltest data report (1998) is available here.
- Slimtube data report 1 (1998 - with HC injection gas) is available here.
- Slimtube data report 2 (1998 - with CO2 injection gas) is available here.
- IFT data report (1998) is available here.
- WAT report (1998) is available here.
- Well 15/9-F4
- Standard PVT report (2008) is available here.
Next Steps
The next step in the certification is to get started with the data digitalization certification. This will get you up to speed on how to tackle a compositional, PVT and sample meta data relevant for the next step, which is fluid model development.