Phase Envelopes - The map of fluid phase behavior
This series explains why the pressure-temperature phase envelope is such a useful "map" for reservoir-fluid phase behavior. It starts with the basic phase-envelope features, then shows how the envelope is used against reservoir, wellbore, and separator conditions. The later posts refine the interpretation by discussing single-phase labeling, two-phase quality lines, cricondenbar/cricondentherm definitions, retrograde condensation, and how changing feed composition to match a target GOR changes the envelope.
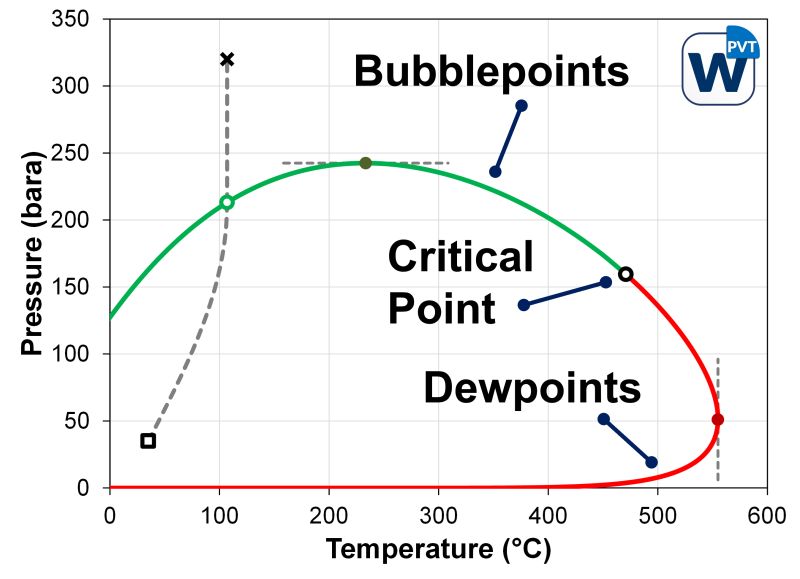
The phase envelope is drawn on a pressure-temperature plot. The outer boundary is made up of the bubblepoint line and dewpoint line. Outside this boundary the fluid is single phase; inside it the fluid is split into two phases.
The main practical message is that the phase envelope is simple enough to teach early, but it hides several important caveats. Labels such as gas, oil, supercritical, gas-like, liquid-like, reservoir oil, reservoir gas, gas condensate, wet gas, and dry gas depend on where operating conditions sit relative to the envelope, and on the basis used for phase fractions.
Post-by-Post Summary
Post 1: Phase Envelope Basics
The first post introduces the phase envelope as one of the most recognizable topics in PVT. It defines the core features of a pressure-temperature phase envelope.
Key terms:
- Bubblepoint line: the line where a lighter phase, commonly called gas, first comes out of solution from a heavier phase, commonly called oil.
- Dewpoint line: the line where a heavier phase first comes out of solution from a lighter phase.
- Critical point: the pressure and temperature where the bubblepoint and dewpoint lines meet, and where the incipient phase becomes identical to the phase it emerges from.
The critical point is the point where the bubblepoint line and dewpoint line meet. It has a critical pressure and critical temperature, usually written as and .
Source: Post 1
Post 2: Using the Phase Envelope as a Production Map
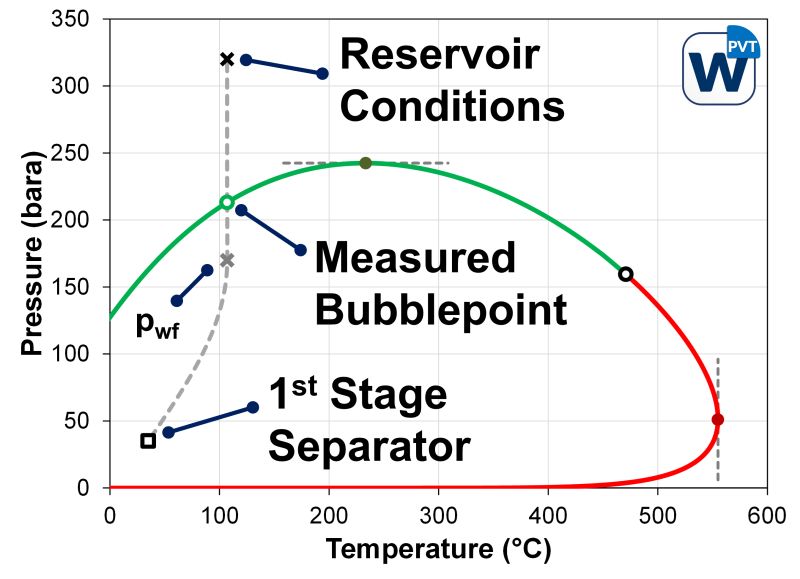
The second post explains that one of the most important uses of a phase envelope is to locate key production conditions relative to the envelope. The post follows a compositional path from reservoir conditions, through depletion, into the wellbore, and toward first-stage separation.
During initial reservoir depletion, temperature is approximately constant while pressure decreases from initial reservoir pressure toward saturation pressure and then flowing bottomhole pressure.
Important points on the path:
- Reservoir condition: the initial reference point for the reservoir fluid.
- Saturation pressure: the pressure at which the path first intersects the phase boundary, often estimated with a constant composition expansion experiment.
- Flowing bottomhole pressure: the pressure condition as the fluid enters the wellbore.
- First-stage separator condition: the downstream pressure-temperature condition used in practical reservoir fluid classification.
The post also notes a caveat: the total composition can change because gas and oil mobilities differ in the reservoir. For the simplified phase-envelope path, composition is treated as constant.
Source: Post 2
Post 3: Single-Phase Regions and Fluid Labels
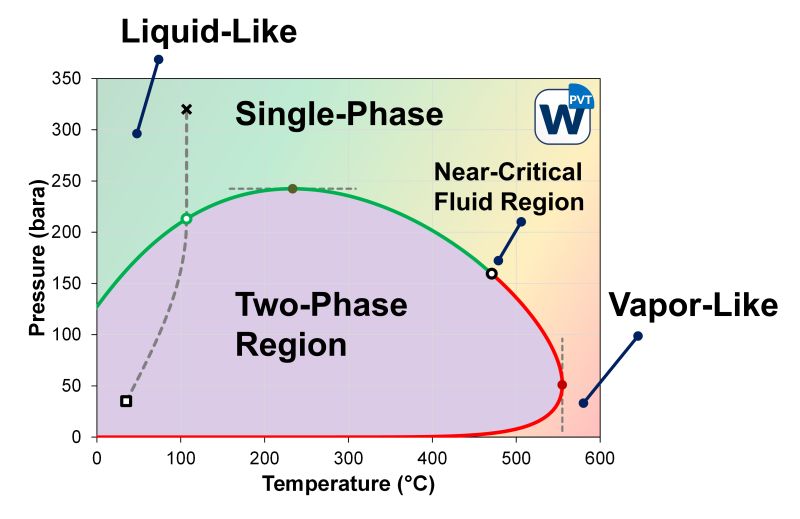
The third post discusses how the phase envelope separates single-phase and two-phase regions. Outside the envelope, the fluid is single phase, but its properties can still vary greatly with pressure and temperature.
The post cautions against overly rigid labels in the single-phase region. Terms like gas, oil, and supercritical can be physically ambiguous when only one phase exists. The preferred language is more qualitative:
- Gas-like: a single-phase state with behavior that resembles gas.
- Liquid-like: a single-phase state with behavior that resembles liquid.
- Near-critical region: the region around the critical point where phases can become difficult to distinguish and calculations can be challenging.
Near the critical point, the gas-like and liquid-like phases become increasingly similar. This helps explain why some calculations become difficult near critical conditions, even though not every supercritical condition is inherently difficult to model.
Source: Post 3
Post 4: Two-Phase Region and Quality Lines
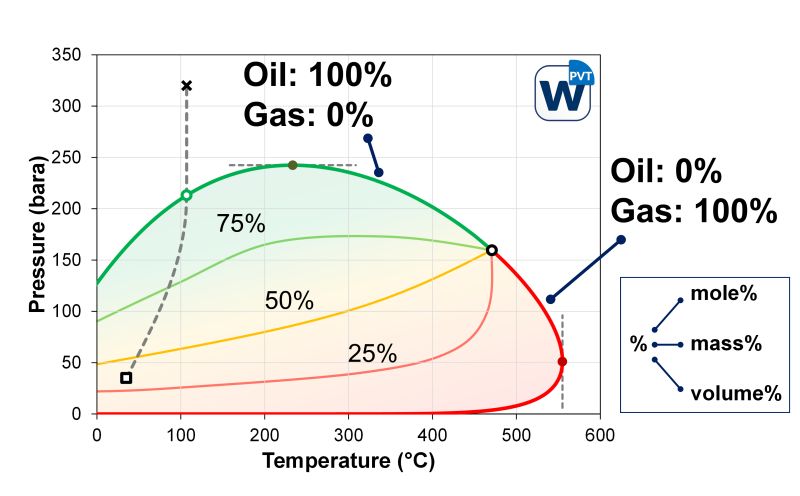
The fourth post moves inside the phase envelope. Inside the envelope there are two or more phases, commonly identified as gas and oil based on density difference.
Some phase-envelope diagrams include quality lines, which act like contour lines inside the two-phase region. They indicate fixed phase proportions, but the basis matters. A "10% gas" quality line can mean 10 mol%, 10 mass%, or 10 vol%, and those are not the same thing.
The post emphasizes that quality lines are often mole-percent lines because that basis is easiest to obtain from the Michelsen phase-envelope calculation commonly used in industry simulation workflows.
Near the critical point:
- Quality lines merge together.
- Small changes in pressure or temperature can cause large changes in phase proportions.
- Incipient phase properties such as density and viscosity approach the properties of the original phase.
Source: Post 4
Post 5: Cricondenbar and Cricondentherm
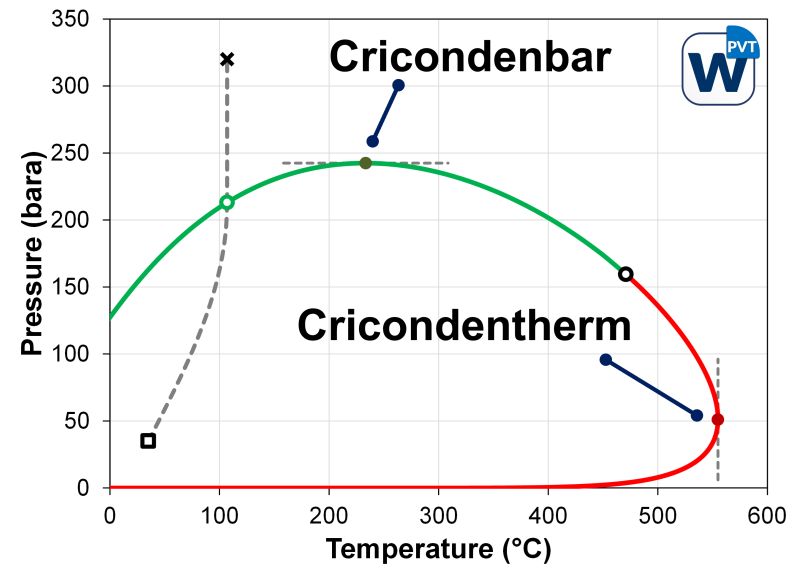
The fifth post defines two less commonly used phase-envelope terms: cricondenbar and cricondentherm. Visually, these mark extreme pressure and temperature limits of the phase envelope, although the post notes that strict "maximum pressure" or "maximum temperature" definitions do not work cleanly for every possible envelope shape.
In everyday language, the cricondenbar is the highest-pressure point on the phase envelope, and the cricondentherm is the highest-temperature point. The post notes that this simple definition is visually useful, even though unusual envelope shapes can make a formal definition trickier.
The cricondentherm is especially useful for reservoir-fluid labeling. It helps distinguish gas condensates from wet or dry gases based on whether a dewpoint can be reached at reservoir temperature.
Source: Post 5
Post 6: Retrograde Condensation
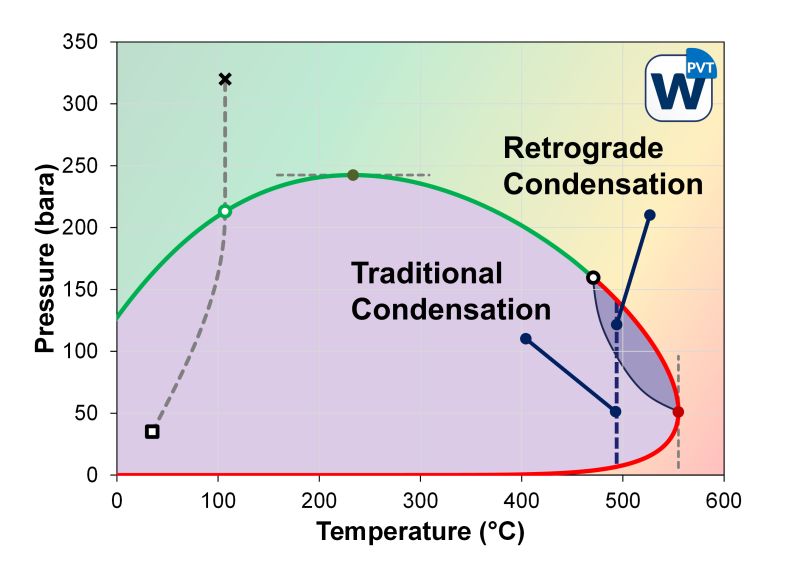
The sixth post adds retrograde condensation to the phase-envelope discussion. It contrasts traditional condensation and retrograde condensation for majority-gas systems.
Traditional condensation:
- Occurs when pressure is increased.
- More liquid comes out of solution from the majority gas phase.
- Appears near the lower dewpoint line during pressure increase.
Retrograde condensation:
- Occurs when pressure is decreased.
- More liquid comes out of solution from the majority gas phase.
- Occurs between the critical temperature and cricondentherm temperature:
In plain terms, retrograde condensation means that lowering the pressure causes more liquid dropout over part of the depletion path. The liquid dropout eventually reaches a maximum and then turns back toward more conventional behavior. The maximum liquid dropout says something about how rich the reservoir gas is.
Source: Post 6
Post 7: Feed Composition, Target GOR, and Phase Envelope Changes
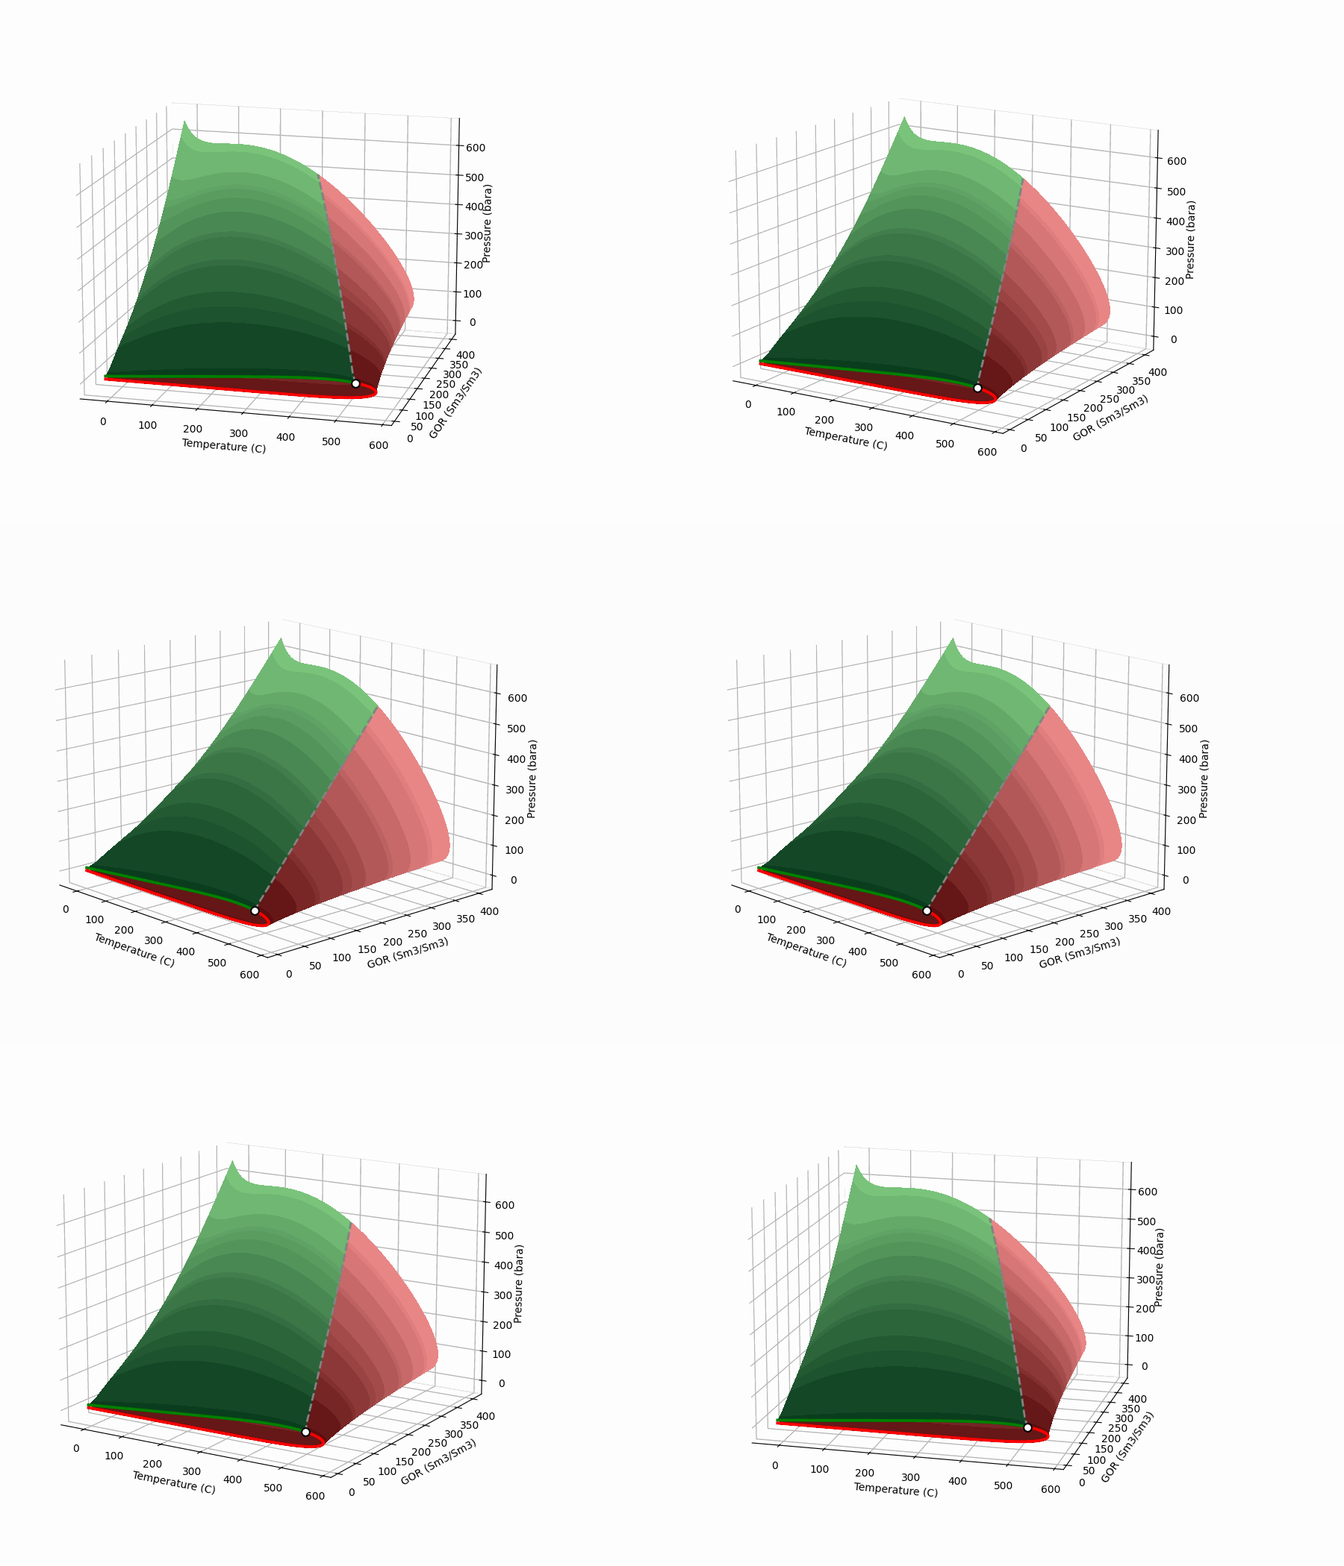
The seventh post shows how changing feed composition to regress toward a target gas-oil ratio changes the phase envelope. This is relevant when converting from volumetric data to compositional data.
A target producing GOR can be represented simply as:
The visualization was generated with the whitsonPVT API and public Python SDK. The technical point is that the phase envelope is not fixed independently of composition. If the feed composition changes to match a target GOR, the envelope changes too.
Source: Post 7
Main Takeaways
- The phase envelope is a pressure-temperature map of phase behavior.
- The bubblepoint and dewpoint lines form the main phase boundary.
- The critical point is where the bubblepoint and dewpoint lines meet.
- Production conditions become more meaningful when plotted relative to the phase envelope.
- Reservoir oil and reservoir gas labels are practical engineering labels, not purely physical single-phase labels.
- Inside the envelope, quality lines depend on the chosen basis: mole, mass, or volume.
- Near the critical point, small condition changes can produce large changes in phase proportions and properties.
- Cricondentherm is useful for distinguishing gas condensate from wet or dry gas behavior.
- Retrograde condensation occurs when pressure depletion causes liquid dropout from a majority-gas fluid.
- Changing feed composition to match a target GOR changes the phase envelope itself.
Practical Implications
When using phase envelopes in PVT work, ask:
- Which composition was used to calculate the envelope?
- Are the displayed quality lines mole, mass, or volume based?
- Where are reservoir, flowing bottomhole, and separator conditions relative to the envelope?
- Is the fluid path assumed to be constant composition?
- Is the fluid near the critical region, where labels and calculations become less straightforward?
- Is the system in a retrograde condensation region during pressure depletion?
- If a target GOR is used to tune composition, how much does that tuning move the envelope?
The series frames the phase envelope as a powerful but conditional map. It is valuable precisely because it simplifies complex phase behavior, but the simplification must be interpreted with awareness of composition, phase-fraction basis, and operating path.